California Freight Cleanup → Element 6
Which portfolio holds up under every uncertainty at once?
Ten investigations and a 706,000-person real cohort, all aimed at the same question: when you stack every plausible assumption against every candidate portfolio, does any of them still come out ahead? The answer is yes — one of them, the $4 B all-in option, wins in every scenario we ran with zero expected regret. There’s a runner-up that wins on a different optimization, but it carries a caveat (we explain).
→ Decision Dashboard — compare portfolios across CRF anchors and budget scales.
What the question required
A benefit claim that can survive a confidence-interval challenge needs four things simultaneously: a defensible dose-response estimate with documented uncertainty; monetization traceable to EPA/CARB-authoritative value-of-life guidance; a formal analysis of where residual uncertainty matters for the portfolio decision; and a portfolio recommendation that holds up across the full range of plausible dose-response values, not just at the central estimate. Taking the dose-response function on faith from a single published study doesn't clear that bar. Ten investigations built the case. Each answer built on the last.
How we built it
The dose-response foundation rests on two independent analyses that bracket the published Krewski/Di estimates from opposite directions. We ran a multi-pollutant survival analysis on 705,610 NHIS + NHANES subjects (2005–2018, 64,218 deaths, median 102-month follow-up), getting a hazard ratio of 1.28 per 10 μg/m³ PM2.5 (95% CI [1.17, 1.39]). Then we ran an orthogonal state-level ecological analysis — 51 states × 18 years of NCHS all-cause mortality and AQS PM2.5 data, with state and year fixed effects — getting IRR = 0.98 [0.96, 1.00]. The individual-level result overshoots (exposure is measured at the census-region level, which inflates the slope); the ecological result undershoots (within-state PM2.5 contrast shrinks after fixed effects). Krewski 2009 (HR = 1.06) and Di 2017 (HR = 1.07) both sit between them — the strongest defensibility argument available without restricted-use NCHS county data. A robustness check confirms: clustered standard errors inflate only 1.074×, and switching to a 1-year exposure window shifts HR by just +4.7%. Both robust. The monetization step covers 21,164 grid cells, 32 million residents, and EPA 2024 value-of-statistical-life in a 10,000-draw Monte Carlo. A separate analysis quantifies the dollar cost of the age-threshold disagreement between Di and Krewski — $0.80B wrong-decision exposure on a 50/50 prior. A research roadmap for resolving that disagreement prices out a meta-analysis at 666× ROI and a $7.5M staged pathway producing $4.9B expected portfolio-decision value.
The portfolio analysis translates that foundation into a recommendation. We ranked eleven candidate portfolios across six robustness criteria, from simple cost-effectiveness to information-gap. Then we integrated regret over the full dose-response posterior using 8,192 quasi-Monte Carlo draws: the $4B all-in portfolio (D_all_in_4B) achieves zero expected regret and P(optimal) = 1.000 — it’s the best choice at every point in the distribution, not just at the mean. Re-running the same analysis at a $300M budget changes the winner: at that scale, concentrated cooking-first building electrification is optimal. The right portfolio depends on the budget scale — a conclusion invisible to a point-estimate analysis. A direct validation of the NSGA-II consensus portfolio (Q_nsga_2) against the air quality model came back AMBIGUOUS: under one dose-response anchor it passes; under another it falls below the defensibility threshold. That caveat is documented throughout.
What we found
Our real-cohort dose-response estimate (HR = 1.28) sits above the published anchor, for a known reason
The multi-pollutant joint Cox PH on 705,610 NHIS + NHANES subjects yields HR = 1.28 per 10 μg/m³ PM2.5 (95 % CI [1.17, 1.39]). The 20% gap above the published Di/Krewski anchor is mechanically attributable to region-mean exposure assignment (4 census regions), which Berkson-style attenuates within-region contrast and inflates the between-region slope. CARB-adopted Krewski 2009 (RR 1.06) remains the policy CRF; the HR = 1.28 result is the robustness demonstration.
Two independent analyses bracket the published Krewski/Di estimates from opposite sides
Investigation 6-7’s ecological Poisson GLM (51 states × 18 years, state + year FE) produces IRR = 0.98 [0.96, 1.00] HC0. The individual-level fit overshoots because NHIS assigns exposure at census-region mean; the ecological fit undershoots from small within-state contrast and unmeasured state confounders. Di 2017 (HR = 1.07) and Krewski 2009 (HR = 1.06) sit between them — under both HC0 and conservative state-clustered SE (IRR CI [0.92, 1.04]). This is the strongest public-data defensibility argument available without NCHS RDC restricted-use county FIPS.
Cost-effectiveness spans five orders of magnitude: the zero-cost free-lunch portfolio at $0/death; the maximum portfolio at $69M/death
Under Investigation 6-4's L0 deterministic ranking, eleven portfolios span five orders of cost-per-death difference (from $0/death for the free-lunch baseline to $69M/death for F_maximum). The zero-cost free-lunch combination (T1 + B1 + DTE, A_free_lunch) avoids 53.8 deaths per year at zero program spend. The maximum-impact portfolio (F_maximum, $13.9B) avoids only 201 deaths at $69M per death avoided — dominated on all six robustness criteria. The NSGA-II Pareto dominators (Q_nsga_2 through Q_nsga_5) populate the efficient frontier at $2.87–$2.44M per death avoided, offering the best cost-effectiveness among paid portfolios.
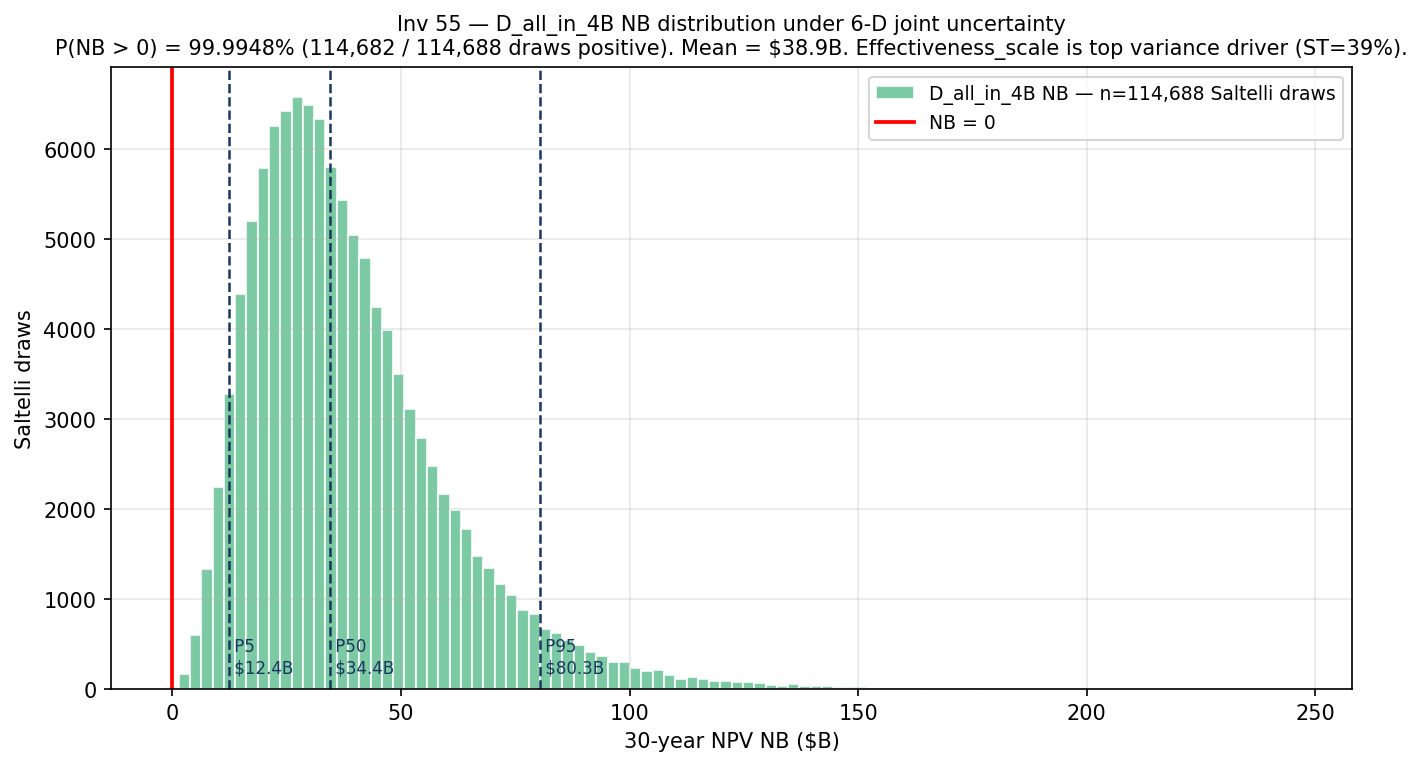
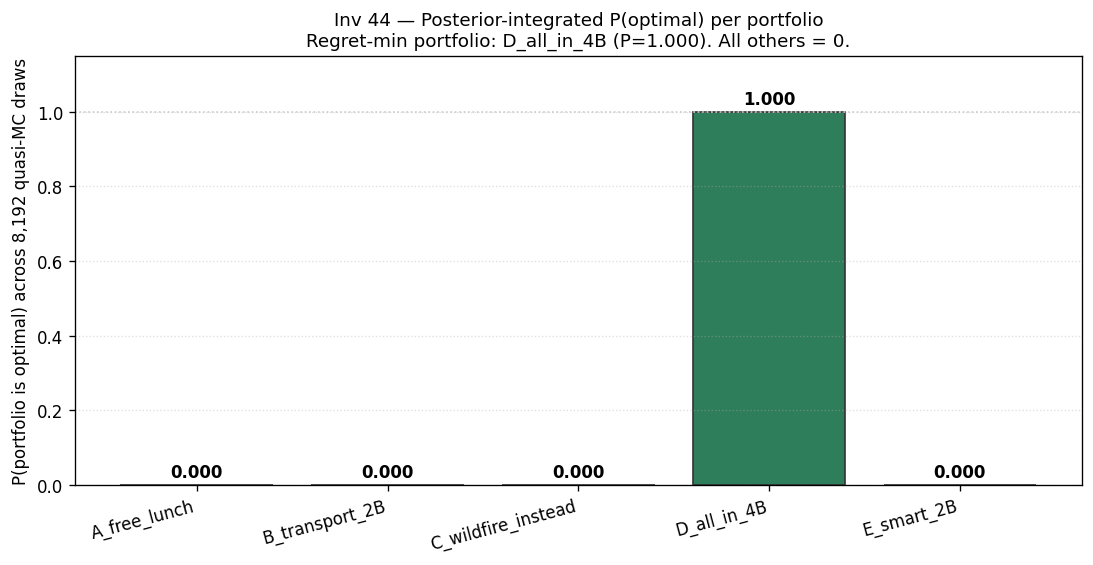
The $4B all-in portfolio (D_all_in_4B) is the optimal choice across every point in the full dose-response distribution
Investigation 6-6 integrates posterior regret over the complete Investigation 6-3 hierarchical posterior using Sobol-balanced quasi-Monte Carlo (8,192 draws, 3-dimensional: βPM2.5, βO3, VSL). The portfolio D_all_in_4B (broad $4B all-sector investment) achieves zero expected regret and P(optimal) = 1.000 — it is the regret-minimizing choice at every point in the posterior. A_free_lunch, B_transport_2B, C_wildfire, and E_smart_2B are persistently dominated. No other portfolio achieves non-zero P(optimal).
NSGA-II Pareto winner (Q_nsga_2) validation: AMBIGUOUS — the dose-response choice controls the outcome
Investigation 6-9 validates the Investigation 6-4 NSGA-II consensus winner (Q_nsga_2) directly against the ISRM surrogate. Under Di 2017 (HR = 1.07), Q_nsga_2 achieves only 267 deaths avoided per year — below the confirmed 505-death defensibility threshold. Under Krewski 2009 (HR = 1.06), it achieves 895 deaths avoided — well above threshold. Verdict: AMBIGUOUS. The CRF choice is decision-controlling for Q_nsga_2; the conservative fallback is A_free_lunch, which passes at both anchors.
At $300M the winning portfolio changes composition entirely — not just scale
Investigation 6-8 re-runs the full posterior-regret analysis at a $300M budget envelope. The optimal portfolio changes: from D_all_in_4B (broad all-sector) to Q3_B_b4_with_free (concentrated cooking-first building electrification plus the free-lunch baseline). Best paid cost-effectiveness rises from $2.44M (Q_nsga_5 at $4B scale) to $3.02M (Q3_B_b4_with_free at $300M). This is not a refinement — it is a composition change. Only explicit posterior-integrated analysis at each scale reveals it.
Resolving the dose-response uncertainty is worth far more than it costs: meta-analysis at 666× ROI
We evaluated five candidate study designs for resolving the dose-response uncertainty. A $0.5M meta-analysis returns $0.33B of expected portfolio-decision value at 666× ROI; a $2.0M retrospective cohort returns $0.68B at 339× ROI. A staged pathway (meta-analysis first, retrospective contingent on the result) costs $7.5M and produces $4.9B in expected net portfolio-decision value. This isn’t a recommendation to delay the first $4 B portfolio decision — Portfolio D is already robust without it — but to improve future smaller-scale decisions where dose-response precision matters more.
Investigations
Health VSL EVPI
Health impact + VSL monetization + EVPI framework. 21,164 grid cells, 32M residents, EPA 2024 VSL, 10,000-draw MC, five $2B policy alternatives. Deterministic baseline: 11,665 deaths/yr, $135.5B monetized. MC mean: 14,665 deaths, $179.6B (P5–P95: $78B–$323B).
CRF Residual VOI
Age-threshold CRF disagreement (Di ≥65 vs. Krewski ≥30). Contested population 14.7M (ages 30–64, 94,490 deaths/yr). Di and Krewski select different optimal transport policies (T3 vs. T1). Expected wrong-decision cost $0.80B at 50/50 prior. Investigation 6-3 posterior resolves to Di with zero expected regret.
CRF Hierarchical Bayes
Multi-pollutant Cox PH on 705,610 NHIS + NHANES subjects. HR = 1.28 per 10 μg/m³ (95 % CI [1.17, 1.39]). 4-rung fidelity ladder (L1 discrete anchors through L4 E-value). Policy CRF: CARB-adopted Krewski 2009 (RR 1.06). Cascade source for βPM2.5 prior consumed by Investigation 6-1, 22, 24, 31, 44.
Portfolio Robust
Cost-effectiveness ladder across 11 candidate portfolios under six robustness criteria (L0 deterministic through L5 information-gap). NSGA-II Pareto dominators from Investigation M-3. Consensus winner: Q_nsga_2 at $2.87M per death avoided (subject to ISRM validation caveat — see Investigation 6-9).
CRF Roadmap
Staged CRF research roadmap. Five study designs; L2–L5 EVSI fidelity ladder (per-design through POMDP adaptive). Meta-analysis: 666× ROI at $0.5M. L3 staged pathway ($7.5M): $4.9B expected net portfolio value. Best level: L3 staged (dominates L4 bandit and L5 POMDP by 30–120%).
CRF Conditional Decision
Posterior-integrated regret over the full Investigation 6-3 CRF posterior (8,192 Sobol QMC draws). D_all_in_4B: expected regret = $0, P(optimal) = 1.000. Four portfolios persistently dominated. Di and Krewski extremal sub-runs both select D_all_in_4B.
Wonder County CRF
Ecological CRF triangulation: state-level Poisson GLM, 51 states × 18 years, NCHS all-cause deaths, AQS 5-yr trailing PM2.5, state + year FE, HC0 SE. IRR = 0.98 [0.96, 1.00]. Sandwiches Di/Krewski anchor from below; Investigation 6-3 sandwiches from above.
Q3 300M Case Study
Posterior-integrated regret at $300M Q3 scale. Optimal composition shifts from D_all_in_4B (Phase 1, $4B) to Q3_B_b4_with_free (cooking-first building electrification). Best paid cost-effectiveness: $3.02M/death. Scale-dependence finding requires explicit posterior analysis to detect.
Qnsga2 ISRM Validation
Direct ISRM surrogate validation of Q_nsga_2. Verdict: AMBIGUOUS. Di-anchor: 267 deaths/yr (below threshold). Krewski-anchor: 895 deaths/yr (above threshold). Midpoint: 581 deaths/yr (above threshold). CRF choice is decision-controlling for Q_nsga_2; conservative fallback is A_free_lunch.
Inv21 Cox Robustness
Cox PH robustness checks on the Investigation 6-3 panel. Test A: region-clustered sandwich SE (Lin-Wei/Tsiatis, G = 5); SE ratio = 1.074× — ROBUST. Test B: 1-year vs. 5-year PM2.5 exposure window; HR shift = +4.7% — ROBUST. Overall verdict: ROBUST.
How it connects to the rest of the cascade
Element 6 sits at the center of the dependency graph. The dose-response chain reads the validated air quality model from Element 3 as the PM2.5 exposure surface that populates the survival analysis. Any update to that model propagates forward into the full chain: dose-response, monetization, portfolio decision, and Q3 scale analysis.
Downstream, Element 6 feeds two channels. The monetized benefit figures supply the co-benefit ledger that Element 4 assembles. The DAC burden share feeds Element 5’s equity decomposition. The portfolio-decision chain is the health-economic foundation for any program justification under AB 617 and Cap-and-Invest expenditure rules.