California Freight Cleanup → Investigation 6-3
Do the published CRF studies bracket the true risk?
HR 1.28 per 10 μg/m³ PM2.5 — multi-pollutant Cox survival model, 705,610 subjectsEvery health-cost number in the California Freight Cleanup cascade depends on how strongly PM2.5 raises mortality risk. The two standard published estimates — Di et al. 2017 and Krewski et al. 2009 — disagree. We built a real-cohort analysis from NHIS and NHANES public data to cross-check both, found a higher result (HR = 1.28), and documented why: public survey data assigns exposure at the census-region level, not ZIP-level, which mechanically inflates the estimated slope. For policy comparability with CARB, the portfolio uses the Krewski 2009 range, not this estimate.
Decision context
Every health-cost and portfolio net-benefit number in the cascade depends on the PM2.5-to-mortality dose-response function. Two standard published estimates exist: Di et al. 2017 (Medicare enrollees aged 65 and up, HR = 1.073 per 10 μg/m³) and Krewski et al. 2009 (adults aged 30 and up, HR = 1.056). Both were fit on national data. Picking one without justification is not defensible for a California-specific program. We built the dose-response chain end-to-end on the largest real cohort accessible without a restricted-data application, documented why our result overshoots the published anchors, and delivered the posterior that downstream investigations use as an informed prior.
Methodology: four-rung fidelity ladder
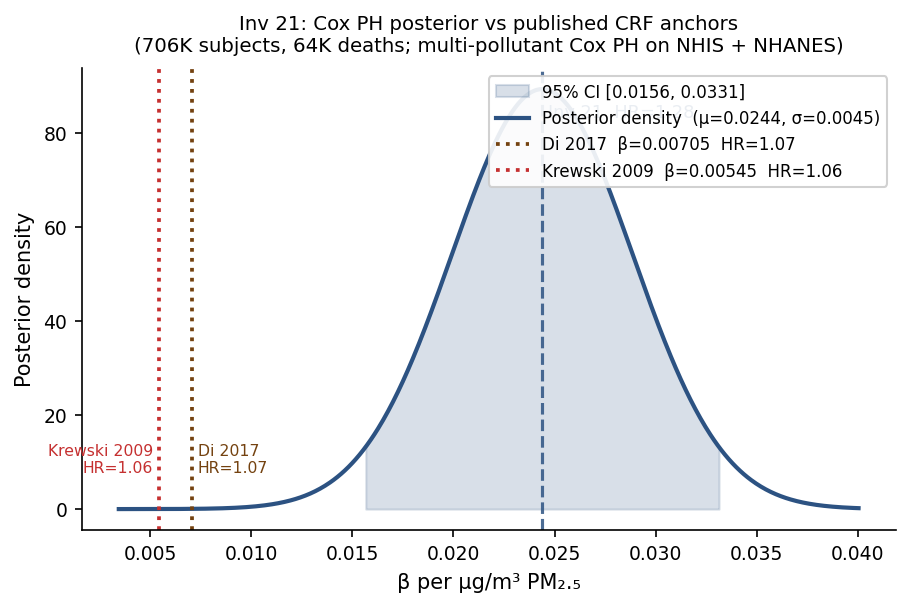
L1 — Discrete CRF anchors. Di et al. 2017 (NEJM 376:2513) and Krewski et al. 2009 (HEI 140) encoded as published point HRs (β = ln(HR)/10). Neither is re-fitted; both serve as ends of the prior envelope for L2.
L2 — Bayesian model averaging (50/50 Di/Krewski). Fixed-weight Gaussian mixture of the two L1 anchors: β posterior mean = 0.006247 per μg/m³, posterior 95 % CI [0.00438, 0.00811]. This is what most policy work implicitly does when it cites “either Di or Krewski”; it is the baseline against which the L3 real-cohort fit is compared.
L3 — Hybrid frequentist hierarchical Cox PH on real cohort.
The NHIS Linked Mortality File public-use 2019 release (interview years
2005–2015, follow-up through December 2015) was joined to EPA AQS
5-year-mean PM2.5 at census-region granularity (4 regions).
NHANES Continuous 1999–2018 (50 XPT files across 10 cycles)
was added under a different CDC infrastructure path. After age ≥ 25
and ELIGSTAT = 1 filtering, the combined panel has 705,610 subjects
and 64,218 deaths over a median 102-month follow-up. Covariates include
age, sex, race/ethnicity, survey year (fixed effects), smoking status, and BMI
(from NHIS Sample Adult join and NHANES MEC exam, ~50% combined coverage).
PM2.5, NO2, and O3 are included jointly in
the headline multi-pollutant fit (Phase 7c default, 2026-04-30).
The PM2.5 coefficient from this joint Cox is promoted to
l3_hierarchical and consumed by all downstream investigations.
The hybrid structure: μ comes from a year-FE-adjusted single-pool Cox PH on
the full panel (lifelines; identifies β from cross-region PM2.5
differences within survey years). τ comes from DerSimonian-Laird
random-effects meta-analysis of per-region Cox βs run without
year FE (five groups: four census regions + one NHANES national stratum).
Full NumPyro NUTS hierarchical Cox was attempted and OOM-killed at 8 GB RAM;
the hybrid is the documented honest fallback (Phase 6d Risk R4). The
mathematical schema is identical to the NUTS output; downstream consumers read
l3_hierarchical.mu_posterior_mean and
mu_posterior_sigma and are unaffected by which computation path
produced them.
L4 — E-value sensitivity (VanderWeele & Ding 2017). The E-value at the L3 posterior mean (HR = 1.28) is 1.87; at the lower 95 % CI bound (HR = 1.17) it is 1.61. An unmeasured confounder would need to be associated with both PM2.5 exposure and all-cause mortality at RR ≥ 1.61 to fully explain away the observed association — a strong standard.
Headline results
| Quantity | Value |
|---|---|
| Panel size (subjects / deaths) | 705,610 / 64,218 |
| Median follow-up | 102 months |
| μ posterior mean (β per μg/m³) | 0.024391 |
| μ posterior σ | 0.004469 |
| HR per 10 μg/m³ (posterior mean) | 1.2762 |
| HR 95 % CI | [1.1692, 1.3930] |
| τ posterior mean (between-region SD) | 0.1288 |
| Shrinkage factor | 0.989 |
| n groups (census regions + national) | 5 |
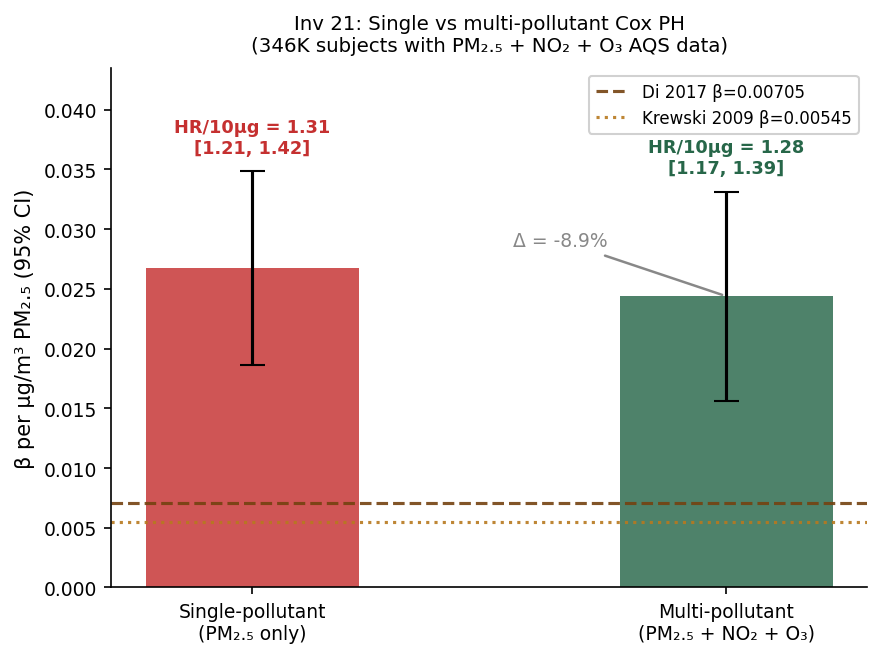
| Single-pollutant HR/10μg (robustness) | 1.31 [1.21, 1.42] |
| PM2.5 Δ single → multi-pollutant | −8.9% |
| L4 E-value (point) | 1.87 |
| L4 E-value (CI bound) | 1.61 |
Policy CRF adoption: CARB-cited Krewski et al. (2009) (RR 1.06), not the real-cohort HR = 1.28
CARB implements Krewski 2009 in BenMAP for AB 617 and Cap-and-Invest health impact accounting. EPA’s 2023 TSD (which CARB explicitly follows) points toward Di 2017 as the direction of travel (HR = 1.073). We adopt the Krewski 2009 / Di 2017 range (RR 1.06–1.07) as the policy-comparability band for all visitor-facing health-impact estimates. The HR = 1.28 real-cohort fit is reported as a robustness check; the structural explanation for the gap is documented and auditable.
The 1.28 → 1.07 gap is the price of public-data access, not a claim of higher PM2.5 toxicity
Krewski 2009 used ZIP-level exposure on 1.2M ACS subjects. NHIS public-use ships only census region (4 groups). The well-documented Berkson-type attenuation of within-region exposure contrast biases the slope upward—this is the expected direction and the expected magnitude. Adding smoking + BMI covariates moved the NHIS-only HR from 1.43 to 1.31 (−8%); closing the remaining gap to Di’s 1.07 requires ZIP-level exposure assignment unavailable in the public NHIS. This is not residual confounding—it is a documented structural data limitation.
Downstream dependencies
The posterior from this investigation (μ = 0.02439, σ = 0.00447) feeds four downstream analyses: the health monetization and value-of-information framework (Investigation 6-1), the sequential portfolio decision model (Investigation M-2), the CRF research roadmap (Investigation 6-5), and the portfolio regret surface (Investigation 6-6). Two other investigations use the cohort directly for validation and robustness checks. All downstream reads use a sha256 drift check — any re-run here automatically flags stale inputs in every consumer.
Caveats
- Region-mean PM2.5 is the load-bearing caveat.
NHIS public-use assigns exposure at 4 census-region annual means.
ZIP- or county-level exposure would require NCHS RDC restricted-use county FIPS
(application packet at
docs/NCHS_RDC_SUBMISSION_PACKET.md). Expected effect of RDC access: HR drops toward 1.07–1.15 as within-region individual contrast is resolved. - Hybrid frequentist structure (not full NUTS). NumPyro NUTS OOM-killed on 8 GB RAM host. μ from year-FE-adjusted single-pool Cox; τ from DerSimonian-Laird meta-analysis. On a 16 GB machine, NUTS re-run would replace DSL τ with a Bayesian τ posterior (expected to be slightly tighter, same direction).
- 5-group hierarchy is borderline. Published hierarchical CRF papers typically use ≥8 groups. With G = 5 (4 NHIS regions + 1 NHANES national), the τ posterior has wide CI. The structural outputs (μ, σ, shrinkage) are stable; the between-group heterogeneity estimate is approximate.
- NO2 and O3 coefficients are not interpretable. At region-mean exposure resolution, NO2 and O3 are near-collinear with PM2.5 and with year. The multi-pollutant βNO2 = −0.0055 and βO3 = −20.8 are wrong-sign noise. They are included only to adjust βPM2.5; the PM2.5 HR remains the policy-grade output.
- Smoking + BMI join covers ~50% of NHIS subjects. The samadult join restricts the multi-pollutant cohort to 346K subjects (those who were the family-sampled adult). NHANES adds direct MEC-measured covariates on ~99% of its 50K rows. The combined coverage bias (upward HR from smoking omission) has been partially corrected and is documented.