California Freight Cleanup → Investigation 6-4
Which portfolio holds its value no matter what?
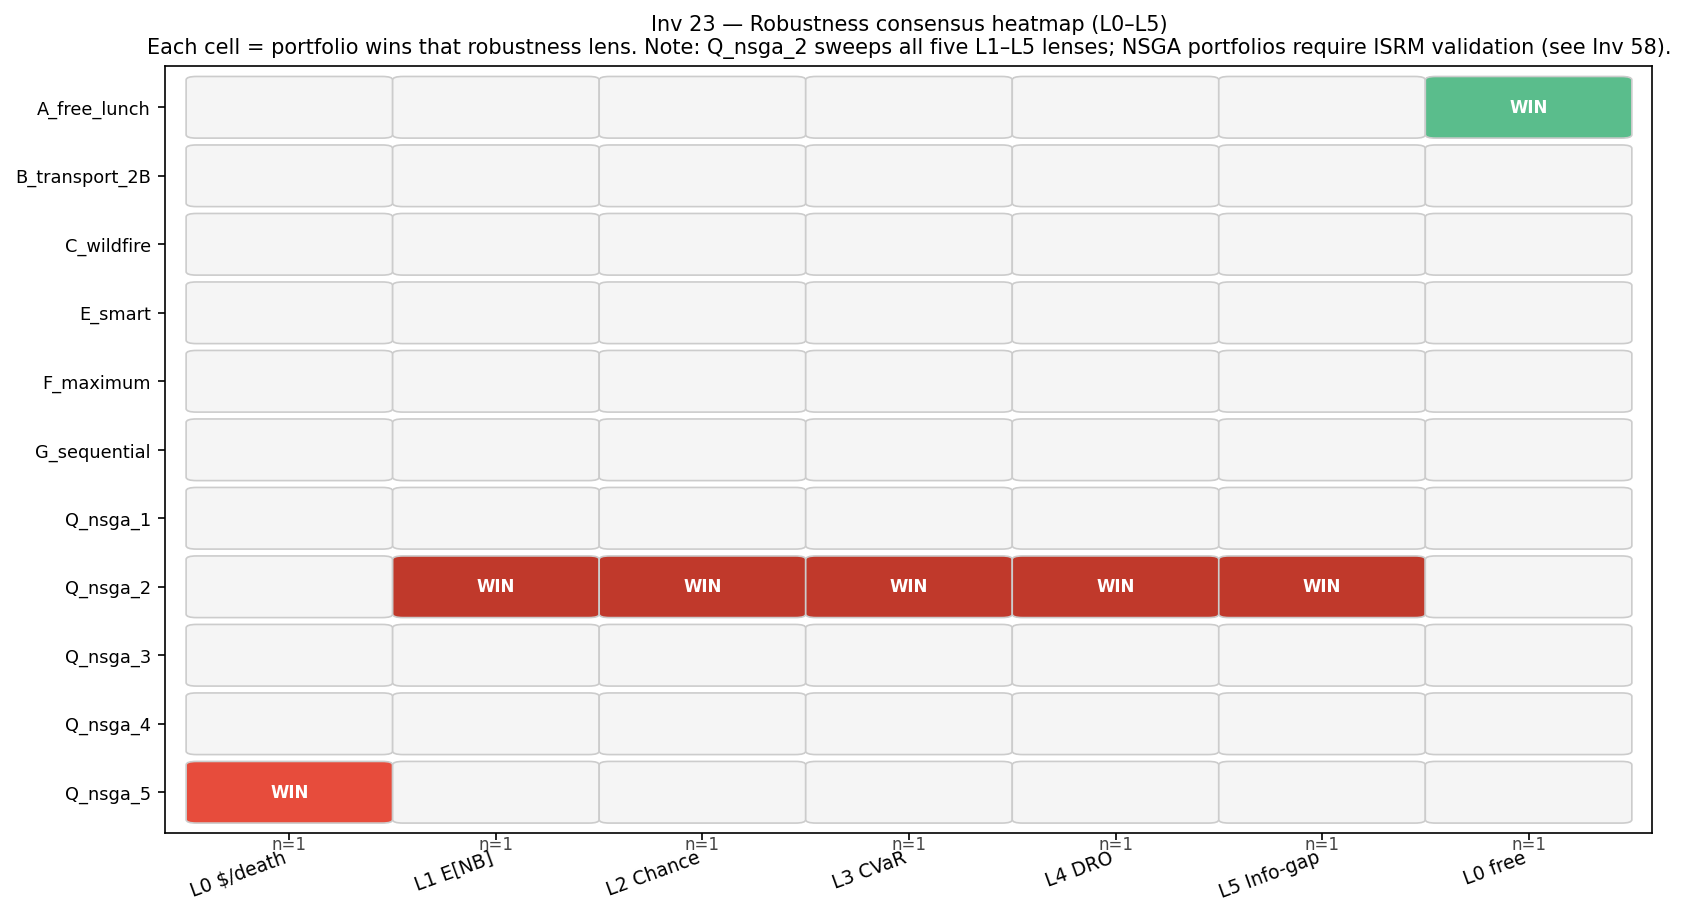
Consensus: Q_nsga_2 (5/5 robustness lenses) — CAVEAT: ISRM validation AMBIGUOUS (see Investigation 6-9)
Eleven portfolio candidates tested against six robustness criteria: a simple cost-per-death ratio, expected-value maximization, a chance constraint on minimum net benefit, the average in the worst 5% of draws (CVaR), a parametric adversarial stress test, and an info-gap horizon. 5,000-draw Monte Carlo, seed 2026.
The decision
Earlier stages ranked portfolio candidates by expected net benefit — a mean that silently assumes the dose-response function, cost, and effectiveness parameters are known well enough that the average is a reliable guide. Phase 2 quantified the actual uncertainty: dose-response CV around 16%, effectiveness CV around 30%, cost CV around 25%. This investigation asks the decision-relevant question: when those uncertainties are taken seriously, does the expected-value ranking hold, or does a different portfolio win?
Anyone presenting a $2B recommendation must be able to say not only “this performs best on average” but also “this choice is defensible if key assumptions shift by realistic amounts.” If the robust winner and the expected- value winner are the same portfolio, the case is straightforward. If they diverge, the decision-maker must choose a risk posture explicitly — not absorb it as a hidden assumption.
Methodology
Six robustness criteria applied in sequence. The first (L0) is a simple VSL-independent cost-per-death ratio. The remaining five use a 5,000-draw Monte Carlo envelope across eleven portfolio candidates: the six named portfolios from the frontier investigation (Investigation M-1), the best sequential policy from the adaptive planning investigation (Investigation M-2, annualized over 10 years), and five NSGA-II Pareto-optimal candidates from Investigation M-3 (labeled Q_nsga_1 through Q_nsga_5).
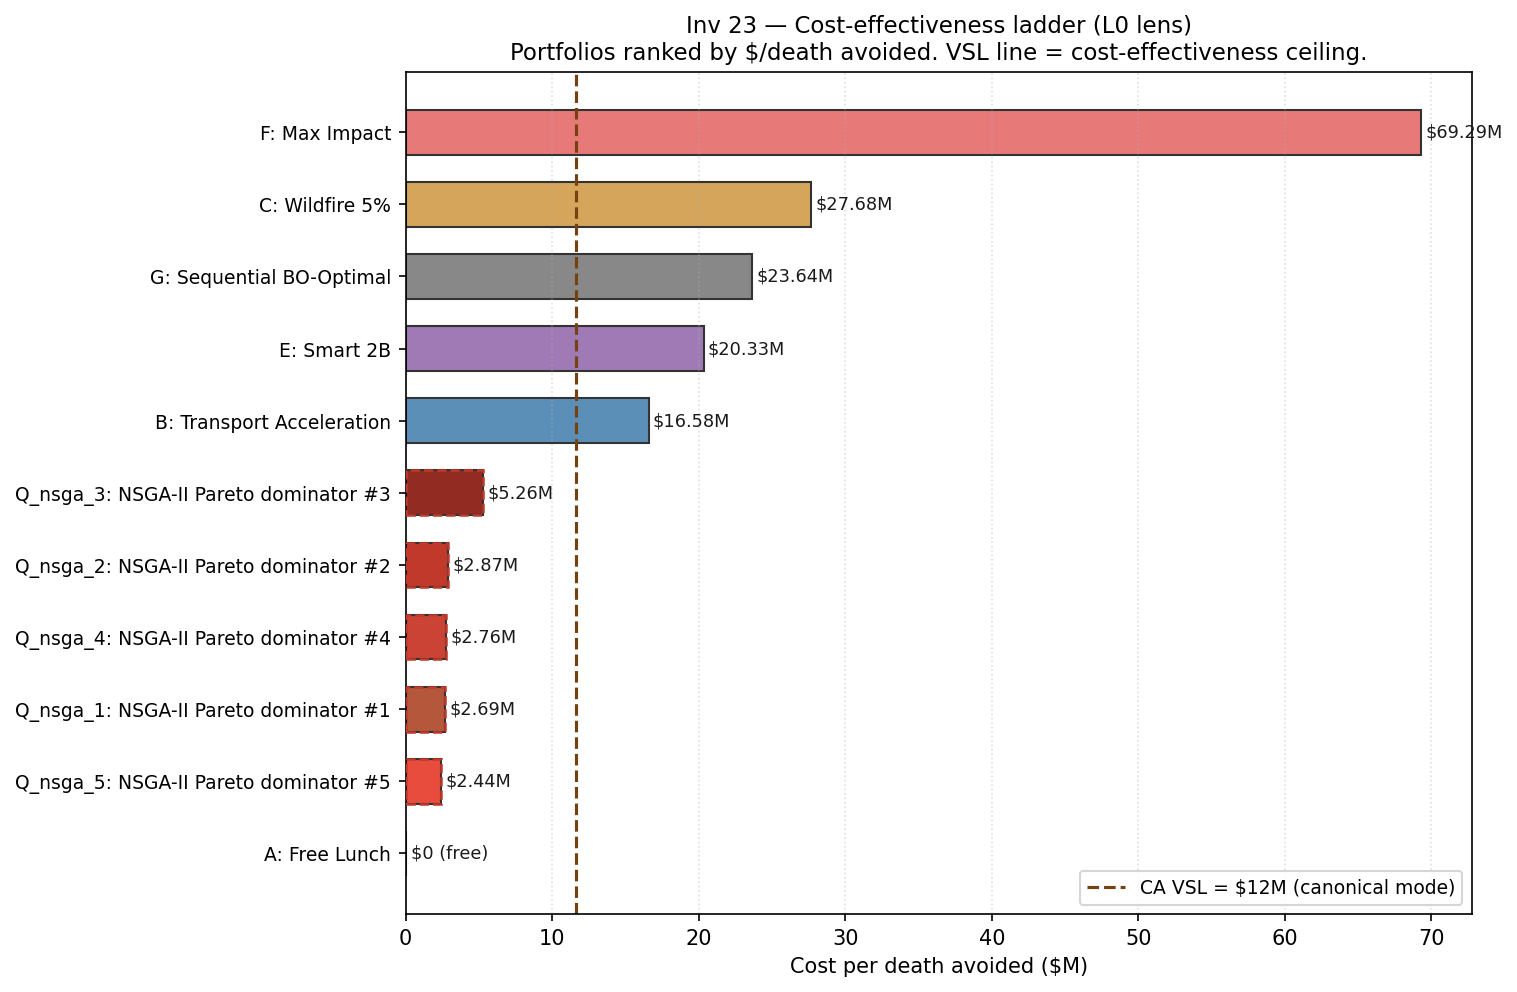
L0 — Cost-effectiveness ($M per death avoided; VSL-independent)
Deterministic ratio of cost ÷ deaths avoided. Zero-cost portfolios rank first by definition. The NSGA-II candidates (Q_nsga_1–5) dominate all paid Phase 1 portfolios: Q_nsga_5 achieves $2.44M/death, vs. $16.6M/death for B_transport_2B and $69.3M/death for F_maximum. The primary differentiator for visitor-facing narrative; uses the metric CARB and EPA employ to defend SIP measures, with an historical acceptance band of roughly $10–30M/death for major air-quality rules.
L1 — Expected-value maximization
5,000-draw MC over the full uncertainty envelope. Net benefit = monetized deaths avoided (California VSL $11.6M) minus cost. Q_nsga_2 wins with mean NB = $+5.92B (SD $3.05B). A_free_lunch earns $+0.67B; B_transport_2B and all other Phase 1 paid portfolios show negative expected NB under this CRF and VSL.
L2 — Chance-constrained programming (Charnes & Cooper 1959)
Require P(NB ≥ $1.0B) ≥ 0.90. Q_nsga_2 achieves P = 0.989 (feasible). Q_nsga_1 achieves P = 0.969 (feasible). All Phase 1 paid portfolios fail (P < 0.13). L2 best: Q_nsga_2 (mean NB = $+5.89B among feasible candidates).
L3 — CVaR0.05 tail risk (Rockafellar & Uryasev 2000)
Expected net benefit in the worst 5% of draws. Q_nsga_2: CVaR = $+1.45B (worst-5% average still positive). Q_nsga_4: $+1.05B. A_free_lunch: $+0.30B. All Phase 1 paid portfolios have negative CVaR, meaning a bad draw wipes out the investment entirely.
L4 — Parametric adversarial envelope (DRO-lite)
Worst-case mean NB over a 4×4 grid of mean-shift (0–30%) × sigma-inflation (1.0–1.6), with cost axis inflated by the Investigation M-2 half-normal cost-overrun factor (1.160). Q_nsga_2 worst-corner NB = $+2.72B (corner: −30% mean, ×1.0 sigma). A_free_lunch worst-corner = $+0.48B. All Phase 1 paid portfolios go negative at the worst corner.
L5 — Info-gap horizon (Ben-Haim 2006)
Largest α-multiplier on base CVs at which the 10th-percentile NB stays above $0.5B. Q_nsga_2 critical α = 1.91 (tied with Q_nsga_4). This means Q_nsga_2 remains viable even when all uncertainty parameters are inflated to 1.91× their base values. Phase 1 portfolios saturate at the search ceiling α = 0.50, indicating they cannot maintain positive NB under any meaningful uncertainty expansion.
Key findings
| Lens | Winner | Key metric |
|---|---|---|
| L0 (free) | A_free_lunch | $0 cost |
| L0 (best paid) | Q_nsga_5 | $2.44M/death |
| L1 EV | Q_nsga_2 | Mean NB +$5.92B |
| L2 Chance-constrained | Q_nsga_2 | P(NB ≥ $1B) = 0.989 |
| L3 CVaR0.05 | Q_nsga_2 | Tail floor +$1.45B |
| L4 Adversarial envelope | Q_nsga_2 | Worst-corner NB +$2.72B |
| L5 Info-gap | Q_nsga_2 | Critical α = 1.91 |
| Consensus | Q_nsga_2 | 5/5 votes, robust = EV pick |
Robust and EV picks agree: robust_matches_ev = true. The same
portfolio that maximizes expected benefit also maximizes resilience to
uncertainty. This is not just an average-case result—it holds across
all five robustness lenses.
A_free_lunch (zero cost, T1+B1+DTE retire) avoids 53.8 deaths/yr with mean NB $+0.67B and a CVaR tail floor of $+0.30B. It is the conservative production recommendation while Q_nsga_2’s ISRM validation remains AMBIGUOUS. Its cost-effectiveness is dominant by definition, but its absolute health impact (54 deaths/yr) is roughly 12× smaller than Q_nsga_2’s surrogate-predicted 631 deaths/yr.
Caveats
- NSGA candidates evaluated on Investigation M-3 surrogate, not full ISRM pipeline. Q_nsga_1–5 deaths and costs are computed via Investigation M-3’s linear surrogate (indoor_deaths_per_b calibrated at the Di/Krewski midpoint). E_smart evaluates to 87.1 deaths/yr on the surrogate vs. 123 deaths/yr in the full Investigation M-1 ISRM pipeline — a 29% underestimate of multi-sector interaction. NSGA portfolios are compared on a consistent within-surrogate basis; full ISRM validation requires running Investigation M-1 with the NSGA x-vectors. See Investigation 6-9 for the pathway-decomposed ISRM validation of Q_nsga_2.
- L4 is a parametric stress test, not full DRO. The adversarial grid (mean-shift × sigma-inflation) approximates Delage & Ye 2010 moment-based ambiguity, but the underlying SDP is not solved. A different mean-shift fraction or sigma inflation would produce different rankings among positive-NB portfolios.
- L5 info-gap ceiling is binding for all Phase 1 portfolios. All Phase 1 portfolios saturate at α = 0.50 because the $0.5B NB floor is unreachable for any of them at any modeled α. The L5 result ranks NSGA candidates but is uninformative about Phase 1 portfolio separation.
- G_sequential annualization is rough. Dividing 10-year cumulative deaths (1,692) by 10 assumes uniform annual benefits. The Investigation M-2 POMDP policy concentrates learning in early periods and benefits later; G’s true annualized performance on a present-value basis requires discounting from Investigation M-2 directly.
- DAC equity weighting not incorporated. All five robustness lenses optimize on aggregate net benefit. Portfolio DAC shares (20.4–30.2%) are tracked but do not enter the objective. Portfolio C (23% DAC, wildfire focus) and Q_nsga_2 (30.2% DAC) would gain under a DAC-conditional floor.
- Stale upstream flags at time of last run. Investigation M-1 and Investigation M-2 sha256 hashes had changed since Investigation 6-4 last ran. Numerical outputs are stable across runs (diff table shows no change on consensus winner), but the stale flag means Investigation 6-4 should be re-run after any upstream update before being cited in production reports.
Provenance
| Field | Value |
|---|---|
| Investigation | 23_portfolio-robust |
| Tier | Tier 1 |
| Run timestamp | 2026-05-04T07:46:21 |
| results.json sha256 | cab2edc05333 |
| MC draws | 5,000 (seed 2026) |
| Upstream: Investigation M-1 | sha256 145dbfd826d0 (named portfolios) |
| Upstream: Investigation M-2 | sha256 ff6e97fe9760 (sequential BO policy) |
| Upstream: Investigation M-3 | sha256 59656b02ceb7 (NSGA-II Pareto frontier) |
| Methods | CVaR (Rockafellar & Uryasev 2000), Info-gap (Ben-Haim 2006), Chance-constrained (Charnes & Cooper 1959) |
| ISRM validation | AMBIGUOUS — see Investigation 6-9 (Q_nsga_2 ISRM validation) |