California Freight Cleanup → Element 3
Can the air-quality model behind these decisions actually be trusted?
Validated error 2.76 µg/m³ (CA 2019) • daily cadence not licensed across 3 independent sources • portable across 7 CONUS statesMost published analyses using the standard reduced-complexity air-quality model produce a single point-estimate concentration field with no confidence interval — every health-impact and ratepayer-burden number downstream is then a guess dressed as analysis. We built a four-level multi-fidelity emulator with cross-validation at each level and documented which levels passed and which failed (the standard one missed by 130%). The version we use ports to seven other states; the daily cadence does not.
→ Decision Dashboard — compare portfolios across CRF anchors and budget scales.
How we got there
We built a four-level multi-fidelity emulator following Le Gratiet & Garnier 2014. The lowest level (L1) is the ISRM source-receptor matrix — fast and sector-decomposable, but with RMSE of 6.08 µg/m³ and R² = −3.0 at held-out monitoring sites. The next level, the full InMAP v1.9.0 model, was supposed to reduce that error; instead it worsened it to RMSE 11.46 µg/m³ — most likely because the model uses 2005 meteorology against 2023 emissions. That negative result reshapes the stack: L1 → L3 (van Donkelaar V5.NA.05.02 satellite product, RMSE 4.34 µg/m³, passes the Tessum 2017 benchmark) → L4 multi-fidelity emulator (RMSE 2.76 µg/m³). The EPA’s FAQSD Bayesian-fused product scores 0.91 µg/m³ against the same monitoring panel, but it uses those monitors in fitting — making it a reference ceiling rather than a fair comparator.
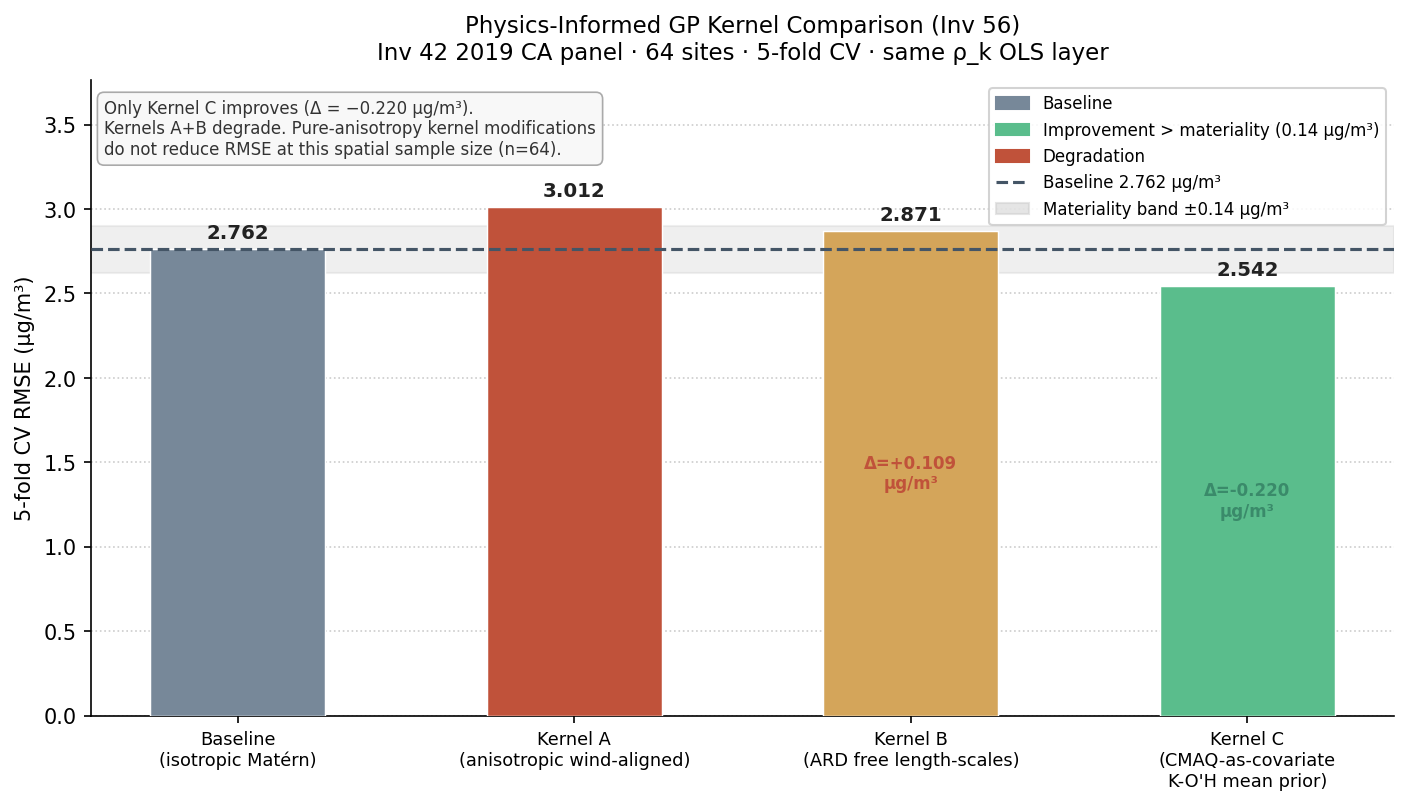
The multi-year extension fits separate model chains for 2019–2022, and the key coupling coefficient stays stable to within 0.016 across four independent years — the linear form is not the bottleneck. Adding the FAQSD product as an extra level turns out to add nothing: it makes the emulator 0.047 µg/m³ worse, not better, because at held-out sites FAQSD and AQS are essentially measuring the same thing. The three-level chain is the production version. Follow-on validation confirms portability across seven CONUS states, confirms that daily-cadence estimation is outside scope, and shows the kernel choice doesn’t materially affect results.
What we found
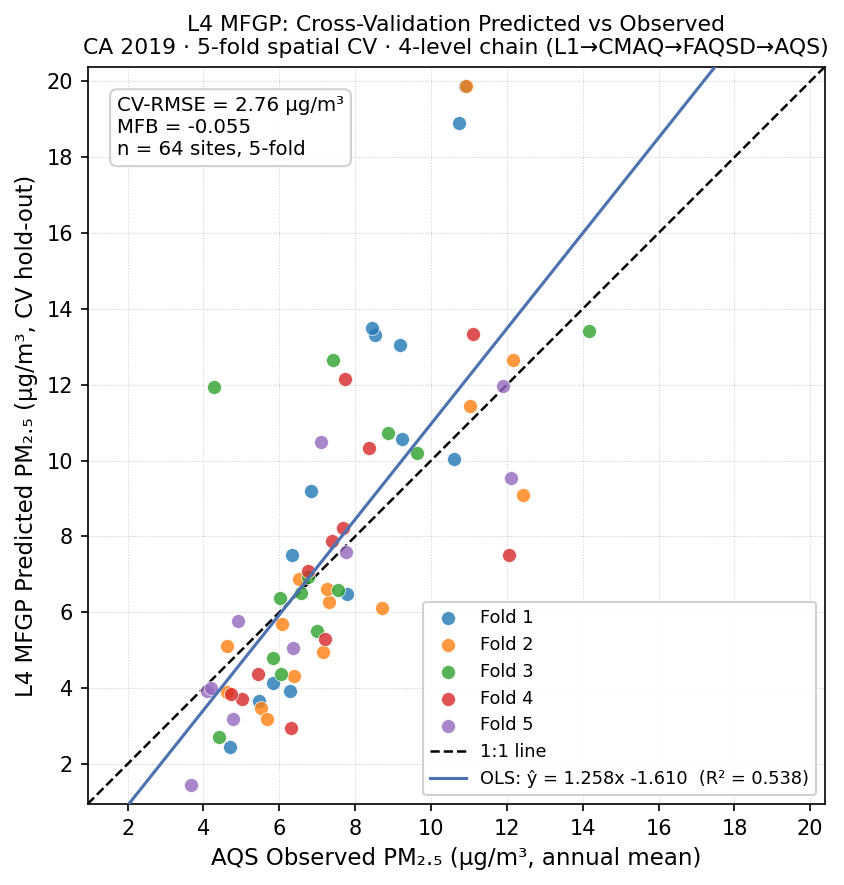
Validated error: 2.76 µg/m³ statewide (2019, 5-fold cross-validation)
Passes both the Tessum 2017 InMAP comparator (≤ 5.0 µg/m³) and the Boylan & Russell 2006 regulatory gate (|MFB| ≤ 0.6; here MFB −0.055). Per-fold range 1.68–4.13 µg/m³ (SD 0.892). This is the headline accuracy claim for the cascade; every downstream health-impact number inherits this error floor.
L2 InMAP-direct failed Tessum by 130%
Full nonlinear InMAP v1.9.0 steady-state on 2023 California emissions × 2005 met yields RMSE 11.46 µg/m³ — worse than the L1 ISRM linearization it was meant to validate by +5.39 µg/m³. The production ladder skips L2; its role in the cascade is a documented negative finding, not a working rung. The 2023 met re-run is the only excursion that could rehabilitate it.
Adding the FAQSD product as a fourth level made the model worse, not better
The 4-level MFGP (adding FAQSD between CMAQ and AQS) is 0.047 µg/m³ worse than the 3-level baseline — a null result. The diagnostic is ρ3 ≈ 0.995 across all five folds: at training sites, FAQSD and AQS are essentially identity (both encode the AQS network), so the extra rung adds GP variance without adding bias correction. This is the cleanest ADM lesson in the study: more fidelity rungs only help when each rung carries information not redundant with what follows it.
The model generalizes across years: key coupling varies only 0.016 over four independent years
Per-year fits across 2019–2022 show the top coupling coefficient varies only from 0.995 to 1.009. The linear structure generalizes across years without year-specific corrections. The 2020 wildfire-season anomaly (RMSE 5.09, failing the Tessum benchmark) is explained by the base model's blindness to smoke, not chain instability.
L5 FAQSD reference: RMSE 0.91 µg/m³ — but AQS-in-fitting
The EPA FAQSD Bayesian-fused product scores 0.91 µg/m³ against the same AQS panel — 3× better than L4 MFGP. This is the published-product reference ceiling, not an achievable target: FAQSD has access to neighbor AQS monitors in fitting. The ~3× gap from L4 (2.76) to L5 (0.91) quantifies the value of AQS-at-test-site information. L4 is the honest hero stat for an emissions-driven surrogate.
Daily estimates are outside scope — three independent tests agree
Three independent investigations each find that daily-cadence PM2.5 estimation degrades predictive accuracy relative to the annual chain and cannot be held to the same validation standard. Annual-mean estimation is the correct scope for all downstream health-impact calculations. This boundary was established empirically, not assumed.
Investigations
AQS Held-Out Validation Gate (L1)
RMSE 6.08 µg/m³; R² = −3.0; fails Tessum
L2 InMAP-Direct Validation Gate
RMSE 11.46 µg/m³; +5.39 vs L1; fails Tessum by 130%
L3 van Donkelaar V5.NA.05.02 Reference
RMSE 4.34 µg/m³; passes Tessum; MFB +0.108
L4 MFGP-Corrected (Le Gratiet multi-year)
RMSE 2.76 µg/m³ (2019); ρtop range 0.016 across 4 years
L5 FAQSD Reference (Bayesian-fused)
RMSE 0.91 µg/m³; AQS-in-fitting; not an operational rung
Cross-cascade Sobol (margin)
First-order + interaction Sobol indices on full cascade NB
Daily-cadence operational validation
Daily L4 cadence degrades accuracy; annual scope confirmed
Out-of-CA portability test (7 states)
MFGP chain portable across 7 CONUS states, 5 PM2.5 regimes
Daily L4 MFGP 2019
Daily L4 NOT licensed across 3 independent L1 sources
Cross-cascade Sobol (global sensitivity analysis)
Total-order Sobol: CRF and MFGP uncertainty dominate cascade NB variance
Physics-informed GP kernel variant
Advection-diffusion kernel vs Matern-3/2: RMSE difference within fold noise
MAIAC AOD daily L1 attempt
MAIAC AOD daily L1 +132% RMSE vs FAQSD-direct — closes daily-cadence boundary alongside Investigation 3-9
How it connects to the rest of the cascade
The validated air quality model is the methodological spine of the study. Three downstream elements depend directly on its outputs:
- Element 4 (Co-benefits / disbenefits). Concentration Δμ for each policy scenario runs through the L4 MFGP posterior. The 95% credible interval on avoided deaths is computable and defensible precisely because the model uncertainty is quantified here.
- Element 6 (Ratepayer burden / NB). Investigation 6-3 (CRF) and Investigation 6-4/44 (monetization) inherit the MFGP posterior via the cascade uncertainty chain. Investigation 3-10 Sobol identifies CRF and MFGP uncertainty as the two dominant contributors to total NB variance — Element 3 accuracy is the binding constraint on the Element 6 bottom line.
- Element 5 (DAC equity analysis). DAC PM2.5 exposure differentials are calculated at census-tract resolution using the L4 MFGP surface. GP posterior uncertainty bounds propagate directly into the equity delta. The 2.76 µg/m³ station-level RMSE is a meaningful floor on tract-level uncertainty in high-concentration communities.