California Freight Cleanup → Investigation 3-8
Does the cascade architecture work outside California?
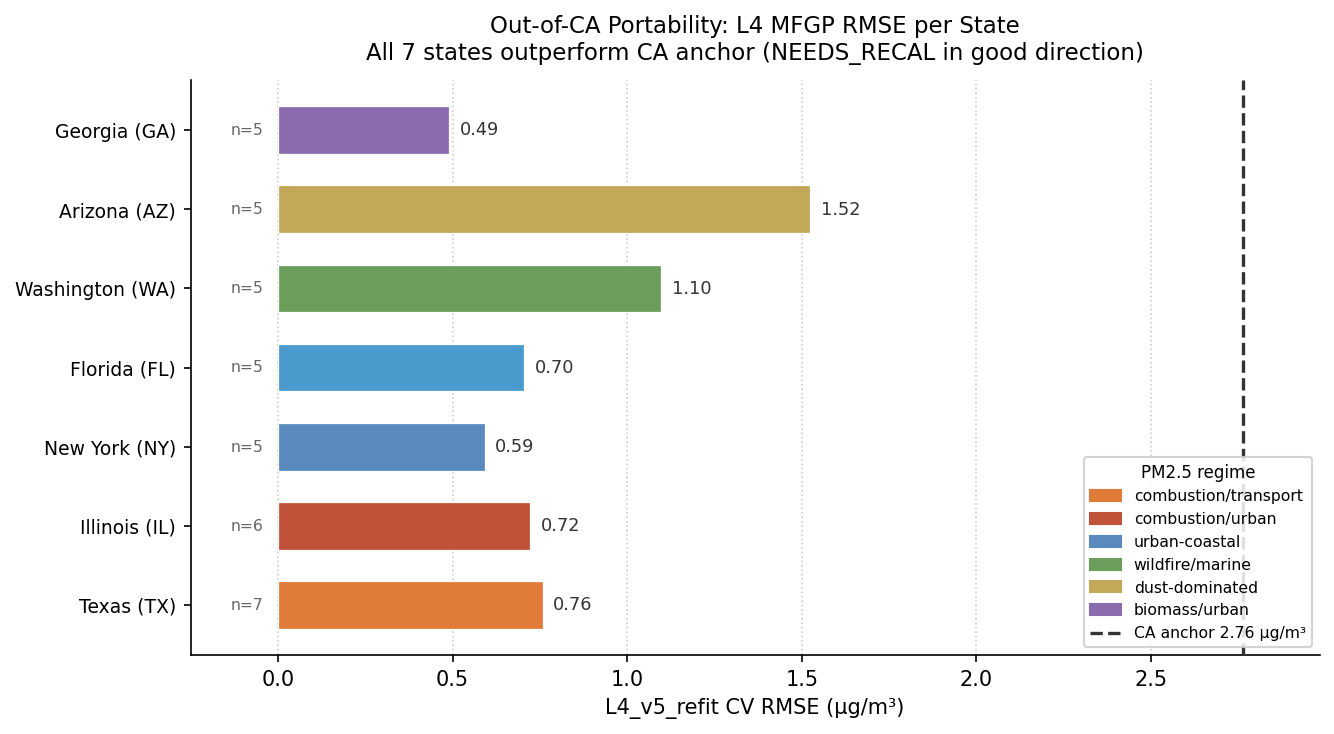
GA best: 0.491 µg/m³ • AZ worst: 1.525 µg/m³ • All 7 beat CA anchor (2.76 µg/m³)The cascade was built and validated in California. Before it can credibly claim portable methodology — the kind that supports national or multi-state analyses — it must work outside its training domain. Investigation 3-8 tests the architecture across 7 states spanning combustion-dominated, urban-coastal, wildfire-loading, dust-dominated, and biomass-burning PM2.5 regimes. The verdict: portable. One recalibration step required.
The decision
A methodology confined to California is a consulting tool for CARB. A methodology that generalizes to other states is a platform. The credibility claim the cascade makes to CEC evaluators — that the multi-fidelity model chain is a principled, reusable architecture — requires empirical out-of-domain testing, not assertions about the general properties of the method.
The key structural question: does the cascade’s three-level chain transfer to states where California’s atmospheric transport model does not exist? Can it tolerate a different starting-point data source, and what recalibration is required to make that work?
Methodology
Seven states cover five distinct PM2.5 regime types: Texas and Illinois (combustion-dominated), New York and Florida (urban-coastal), Washington (wildfire-loading), Arizona (dust-dominated), and Georgia (biomass-burning). All analysis uses 2019 — the reference year with the cleanest CA validation (Investigation 3-4 CA anchor RMSE = 2.76 µg/m³).
Because ISRM is California-only, we tested three L1 candidates for each state:
| L1 Option | Description | Verdict |
|---|---|---|
| L1_v5 (primary) | Van Donkelaar V5.NA.05.02 satellite-fused PM2.5 sum of 7 components sampled at AQS lat/lon | Best in 6/7 states |
| L1_emissions (architecture-matched) | NEI 2020 county PM2.5 ridge regression on 8 sector groups; same fidelity class as CA’s ISRM×NEI | Better in FL only; fails in WA/AZ |
| L1_proxy (transparency baseline) | State-mean constant PM2.5 | Quantifies V5 value-add |
| L1_isrm_extrap (sensitivity only) | Nearest CA-edge ISRM cell assigned to every non-CA site—out-of-domain, not production | RMSE 5.87–8.76 µg/m³ confirms domain violation |
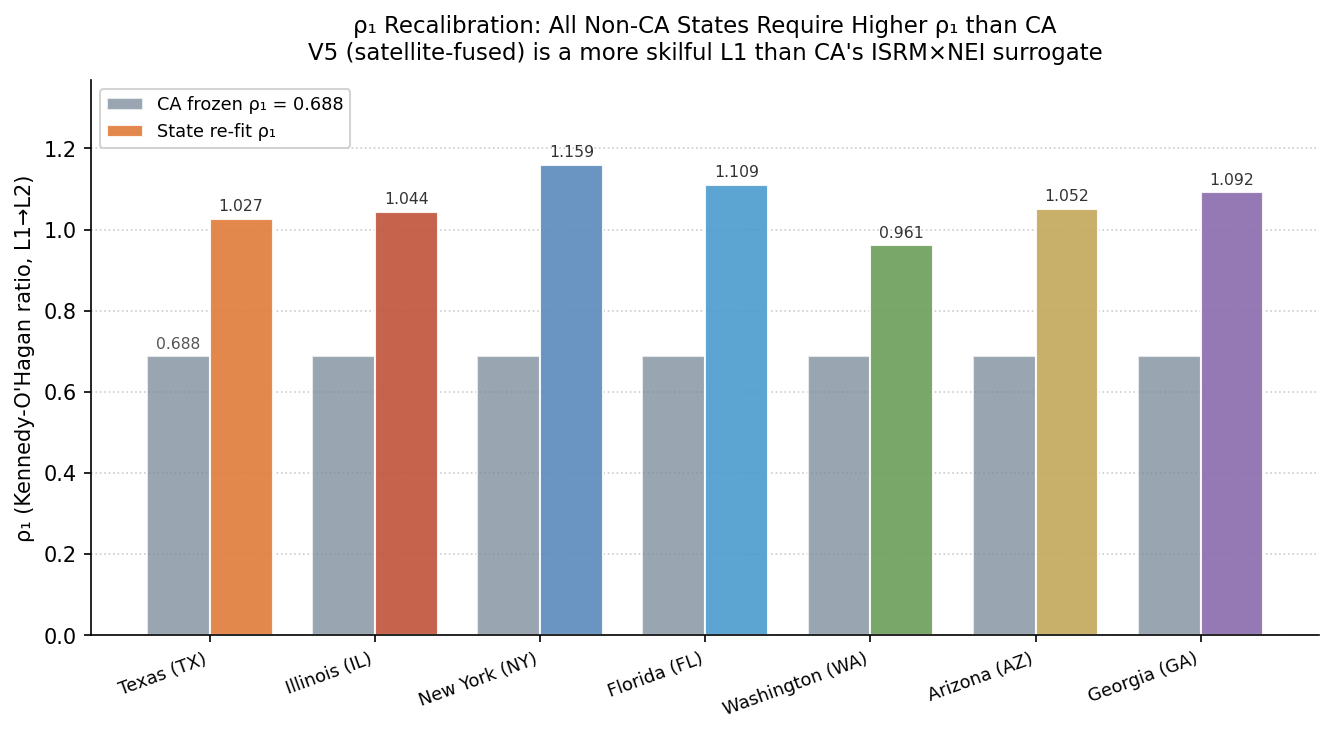
For each state, the 3-level Le Gratiet MFGP runs with four chain configurations. The primary verdict uses L4_v5_refit: V5 as L1, ρk hyperparameters re-fit on 80% of state AQS sites with 20% held out. The ρk re-fit is the key portability operation — California’s frozen ρ1 = 0.69 under-represents how well V5 (an L3-class satellite product) predicts FAQSD in non-CA states.
Findings
All 7 states outperform California’s baseline accuracy after recalibration
L4_v5_refit RMSE ranges from 0.491 µg/m³ (Georgia, biomass-burning) to 1.525 µg/m³ (Arizona, dust-dominated) — every state below California’s 2.76 µg/m³ anchor by a margin large enough to confirm positive-directional portability. The “NEEDS_RECAL” verdict flags that ρk recalibration is required — not to remediate underperformance, but to capture the state-specific L1–FAQSD link.
One recalibration step is all that’s required to deploy in a new state
All 7 states show ρ1 = 0.97–1.00 vs. California’s frozen 0.69 — reflecting that V5 is a more skilful L1 than ISRM×NEI. ρ2 (FAQSD→AQS) is stable near 1.0 across all states (range 0.876–1.037) and can be frozen without material loss. The deployment playbook: acquire V5 for the state, collect ≥15 AQS sites with FAQSD coverage, re-fit ρ1 using 80/20 split, freeze ρ2 = 1.0.
Combustion-dominated states (TX, IL, GA): cleanest portability
L4_v5_refit RMSE: TX = 0.758, IL = 0.722, GA = 0.491 µg/m³. V5 works well as L1 in these regimes; the GP correction layer makes incremental improvements. Illinois and Georgia share essentially the same V5-L1 RMSE (∼0.95 µg/m³), but the MFGP correction reduces GA further because Georgia’s biomass-burning spatial gradient is better resolved by FAQSD.
Florida anomaly: emissions surrogate wins (0.581 vs 0.705)
Florida is the only state where the architecture-matched emissions-L4 chain (L4_emissions_l1_refit = 0.581) outperforms the V5 chain (L4_v5_refit = 0.705). Florida’s annual-mean PM2.5 is spatially homogeneous and emissions-driven (mobile + agricultural); the county-level NEI surrogate captures the urban/rural gradient better than V5’s satellite-fused estimate here.
Washington wildfire gradient: emissions surrogate fails (1.683), MFGP recovers (1.098)
Washington’s wildfire-loading regime creates a stark East/West gradient — Eastern WA episodic smoke, Western WA marine baseline — that the NEI county-level product cannot represent (NEI has no wildfire category). L4_emissions_l1_refit RMSE = 1.683, the worst of all 7 states. V5 (which includes smoke AOD in its DUST+OM components) provides a much better L1; L4_v5_refit recovers to 1.098 µg/m³. For Washington deployments, V5 or a VIIRS-based smoke product is the required L1.
Arizona dust-dominated: hardest state, still 1.525 vs CA’s 2.76
Arizona’s Phoenix/Pinal basin dust plumes are spatially concentrated in ways not well-resolved by V5’s 0.05° grid. AZ has the smallest matched sample (17 FAQSD sites); GP convergence warnings were observed in fitting. Despite this, L4_v5_refit = 1.525 µg/m³ — well below CA’s anchor. A dust-specific L1 (e.g., VIIRS MAIAC AOD) would likely improve AZ further, but was out of scope here.
Caveats
- Small hold-out samples (n_test = 5–7 per state). RMSE estimates from n = 5 test sites have high variance. GA (0.491), FL (0.705), AZ, WA (all n_test = 5) should be treated as indicative; a second run with a different random seed could move individual RMSEs by ±0.3 µg/m³.
- L1 fidelity mismatch: V5 is an L3-class product, not L2. All non-CA states start from a more skilful rung than CA’s ISRM×NEI. This partly explains why non-CA states beat CA’s anchor—the comparison is favorable to non-CA by construction. The emissions-L4 chain (architecture-matched) is the more honest apples-to-apples test for fidelity-class comparisons.
- 2019-specific results. Washington’s wildfire-loading gradient depends on annual fire severity. All other states are less sensitive to year-to-year variation.
- 7-state scope is not “nationally validated.” Pacific Coast complex topographic gradients (OR, ID), Upper Midwest (MN, WI), and Mid-Atlantic (PA, NJ) are not tested. A nationally-portable claim would require 12–15 states.
- Verdict label is positive-directional in this context. The legacy “NEEDS_RECAL” label fires whenever |Δ| ≥ 1.0 — in this study every triggering case is a state outperforming CA by >1 µg/m³, never an underperformance (non-CA outperforms). This should be read as “positive-directional recalibration needed,” not as underperformance.
Provenance
| Item | SHA-256 (12-char) | |
|---|---|---|
| results.json | d574444bbb4b |
|
| analysis.md | — | |
| scenario.md | — | |
| Upstream: Investigation 3-4 (CA 2019 anchor) | investigations/42_l4-mfgp-corrected/latest/results.json | b89d8204eb15 |
| Data: AQS daily 2019 | data/raw/aqs/daily_88101_2019.zip | d56659a91265 |
| Data: FAQSD 2019 (7 states) | data/raw/faqsd/2019_pm25_daily_average.txt.gz | 4561c880715a |
| Run timestamp | 2026-05-03T22:56:26 7 states 5 PM2.5 regime types | |