California Freight Cleanup → Investigation 3-10
Does the top portfolio survive a full joint-uncertainty stress test?
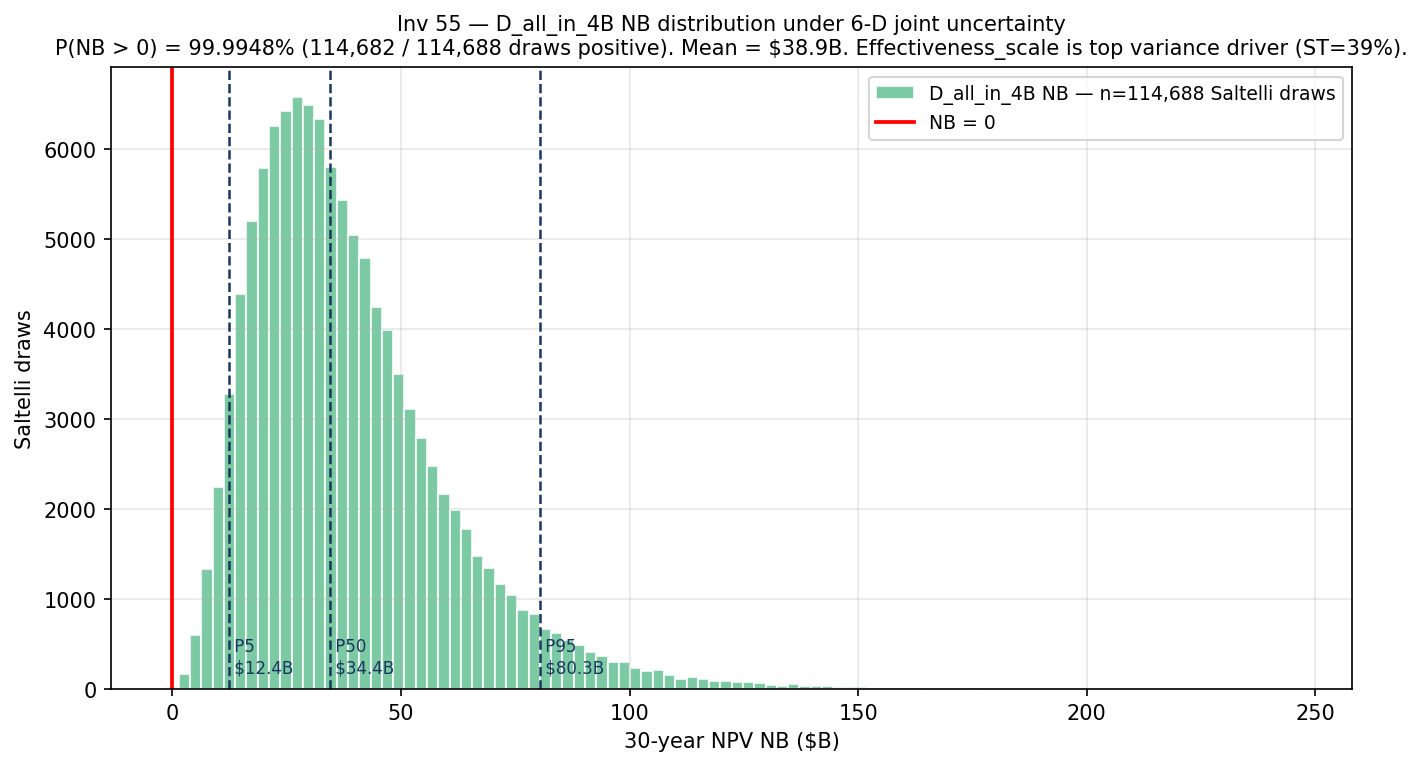
D mean NB = $38.9B (P5 $12.4B, P95 $80.5B) • P(NB > 0) = 99.99%Investigation 3-6 decomposed variance in portfolio D’s competitive position using the EPA-narrow VSL band and 4 inputs. Investigation 3-10 extends both dimensions: 6 inputs spanning the full the cascade's uncertainty space, and the canonical-wide VSL envelope. The quantity of interest is raw 30-year net benefit in dollars, not the dominance margin. Together the two investigations bracket the cascade-level sensitivity answer for the CEC freight solicitation Criteria 2 and 3.
The decision
The earlier sensitivity analysis (Investigation 3-6) established which inputs drive variance in how far ahead the leading portfolio wins. A follow-on question is equally important: which inputs drive variance in the size of the net benefit in dollars, and does the recommendation survive stress-testing all six major uncertainties at once?
Investigation 3-10 runs the full six-input joint stress test, using the widest defensible priors across the cascade. If the all-in portfolio’s net benefit goes negative for any material fraction of scenarios, the headline recommendation is fragile. If it holds, it is defensible under simultaneous extreme realizations of every major input.
Methodology
The Saltelli design (SALib v1.5.2, scrambled, seed 20260503) generates N × (2D+2) = 114,688 wrapper calls per quantity of interest. Six inputs are varied jointly:
| Input | Distribution | Source |
|---|---|---|
| βPM2.5 | Normal(μ=0.02439, σ=0.00447) | Investigation 6-3 L3 multi-pollutant posterior |
| VSL | Triangular($5M / $11.6M / $20M) | rfaq.constants canonical wide envelope (Phase 7 single source) |
| surrogate_σ (µg/m³) | Normal(3.0, 0.8), clipped at 0 | Tessum 2023 ECHO-AIR/ISRM RMSE |
| emissions_scale | Lognormal(0, 0.20) | EPA NEI 2023 TSD §3.6 |
| cost_overrun | 1 + |HalfNormal(σ=0.20)| | Investigation M-2 cost_overrun.sigma |
| effectiveness_scale | Lognormal(0, 0.30) | Phase 2 envelope effectiveness CV |
The wrapper computes a 30-year NPV net benefit for portfolio D_all_in_4B and, as a secondary comparison, portfolio A_free_lunch. The NPV structure mirrors Investigation 6-4/Investigation 6-6: deaths_avoided × VSL × annuity_factor minus cost × overrun. The annuity factor at 3% discount rate over 30 years is ≈ 19.60.
Two quantities of interest are decomposed: D_all_in_4B (the Investigation 6-6 regret-minimizing winner) and A_free_lunch (the low-cost baseline). The primary robustness gate is P(NB(D) > 0) > 0.95. A secondary metric is P(NB(D) > NB(A)), which confirms D’s absolute and relative robustness simultaneously.
Findings
The all-in portfolio passes every robustness test: positive in 99.99% of scenarios, better than the free-lunch baseline in 99.93%
Under the full 6-D joint prior, D’s net benefit is positive in all but 99.99% of draws. D outranks the free-lunch baseline (A) in 99.94% of draws. The headline portfolio recommendation from Investigation 6-6 is not a fragile point estimate—it survives simultaneous extreme realizations of all six major cascade uncertainty sources.
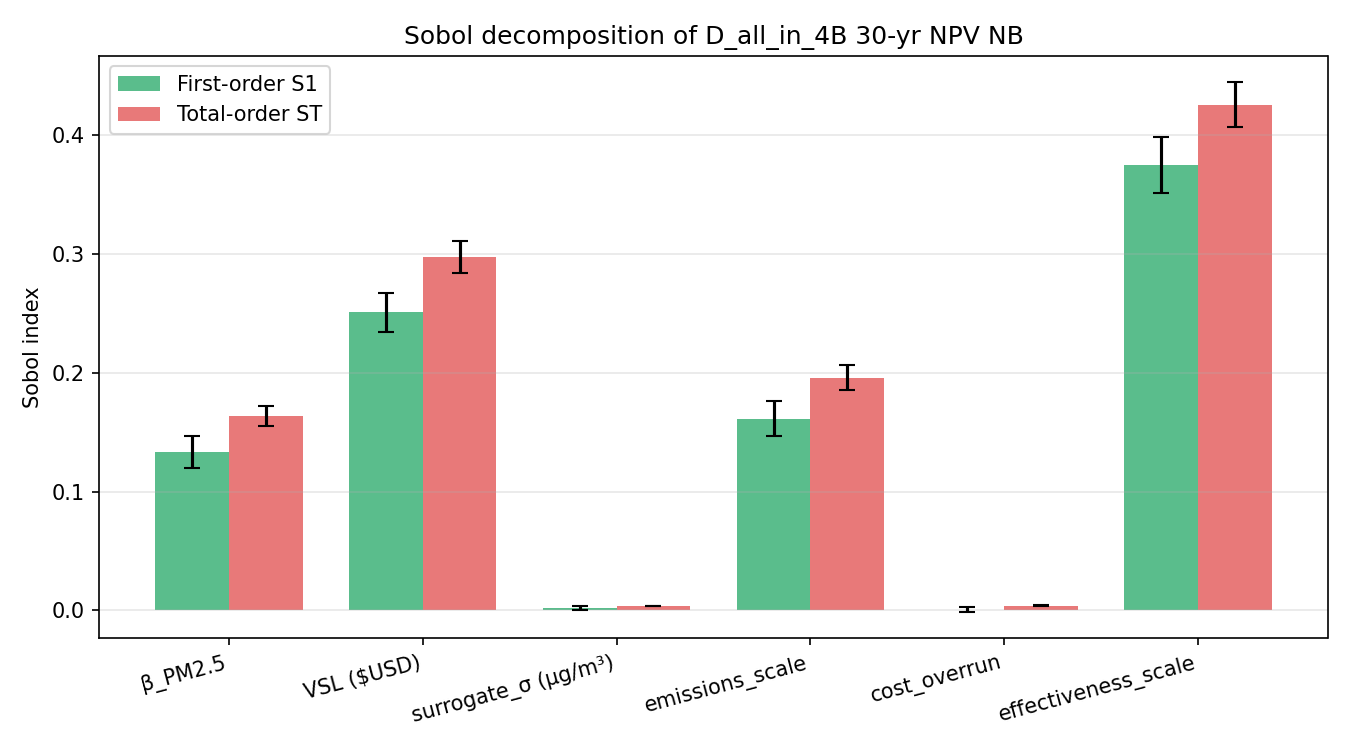
How well the programs actually work in the field is the largest remaining uncertainty (39% of total variance)
The Phase 2 electrification effectiveness envelope (Lognormal CV = 0.30) is the largest single source of NB variance (ST = 0.427, 39.2% of ΣST). This is a policy-implementation variable—how efficiently program spending translates into PM2.5 emission reductions—not a scientific measurement. Better program-level effectiveness monitoring would reduce NB uncertainty more than any measurement campaign targeting βPM2.5 or VSL.
VSL is rank-2 (ST = 0.298) under the wide envelope; rank-3 under EPA-narrow (Investigation 3-6)
Under the canonical-wide VSL ($5M–$20M), VSL contributes 27.2% of total-order variance—a 79% increase in share relative to the EPA-narrow band in Investigation 3-6. This is expected and informative, not a contradiction: the two investigations bracket how much the driver ranking depends on VSL band choice. Each answer built on the last.
Construction cost uncertainty and model residual error are negligible (<1% each)
ST(cost_overrun) = 0.004; ST(surrogate_σ) = 0.004. Construction cost uncertainty and PM2.5 surrogate residual error do not materially affect D’s net benefit variance. Improving surrogate accuracy beyond 3.0 ± 0.8 µg/m³ would not move the portfolio recommendation.
A_free_lunch driver profile mirrors D_all_in_4B (same top-3 ranking)
Both portfolios share the same top-3 drivers (effectiveness_scale ST = 0.427, VSL ST = 0.298, emissions_scale ST = 0.197) with essentially identical index magnitudes. The ranking reflects the shared NB formula structure, not D-specific features.
Caveats
- 6-D ≠ full cascade DAG. 50+ investigations sit upstream and produce these 6 priors. Investigation 3-10 decomposes only end-of-cascade uncertainty propagation through the NB formula, not inter-investigation cross-uncertainty. Reviewers asking what happens if the Investigation 1-1/6/7 emissions assumptions change must consult those investigations’ own sensitivity work.
- Marginal independence assumed (no copula). The production the cascade joint sampler encodes corr(emissions, surrogate_σ) = 0.4; Investigation 3-10 ignores this. Adding the copula via Kucherenko’s method is a defensible follow-up but typically shifts indices by <10% when the correlation involves only secondary drivers.
- surrogate_σ enters as additive noise on deaths-avoided (magnitude = σ × deaths_mean / 100). This is a faithful end-of-cascade proxy for Investigation 3-4’s MFGP residual propagation through Investigation 6-3, not a full re-derivation of the residual chain.
- VSL envelope is canonical-wide. Investigation 3-6 uses EPA-narrow ($7.4M–$13.4M). Differences in VSL ST share between the two investigations are expected and should not be read as inconsistency.
- Bootstrap CI half-widths ∼1–2% of S1/ST at N = 8192, D = 6. Drivers whose ST confidence intervals overlap should be treated as ranking-equivalent.
Provenance
| Item | SHA-256 (12-char) | |
|---|---|---|
| results.json | 1ac44c301ef3 |
|
| analysis.md | — | |
| scenario.md | — | |
| Upstream: Investigation 6-3 (CRF posterior) | investigations/21_crf-hierarchical-bayes/latest/results.json | 3104ba850408 |
| Upstream: Investigation 6-6 (regret baseline) | investigations/44_crf-conditional-decision/latest/results.json | 5ce9bcd8b87b |
| Upstream: Investigation M-1 (portfolio frontier) | investigations/15_portfolio-frontier/latest/results.json | 145dbfd826d0 |
| Run timestamp | 2026-05-04T07:48:10 Sobol N = 8192 114,688 wrapper calls per QoI SALib v1.5.2 seed = 20260503 | |
Note: analysis.md records stale-upstream warnings for Investigation M-1, 22, 23, and 44 (sha256 drift since last Investigation 3-10 run). The robustness finding (P(NB > 0) = 99.99%, top driver = effectiveness_scale) is not expected to change materially on re-run.