California Freight Cleanup → Element 8
Are more air-quality sensors worth the money?
VOI ≈ $0 in default conditions • $0.17 B in tight-decision regimes • the leverage is in better health-effects research, not more measurementsIn the default conditions for this decision: no — the value of more sensors is essentially zero. Health-effects (dose-response) uncertainty already dominates the portfolio decision; more measurement buys you precision, not different choices. We built the full sensor-placement toolkit anyway — per-cell value mapping, adaptive sequential placement, cost-aware multi-fidelity screening, Bayesian sensor fusion — because that’s the only way to establish the “not worth it” finding honestly. And we found one regime (loose health-effects anchor, tight decision threshold) where it would be worth roughly $0.17 B.
What the question required
The question isn’t “where should we put more monitors?” It’s a decision question: where does additional PM2.5 measurement reduce health-impact uncertainty enough to actually change which portfolio to fund? We built the full placement methodology and returned an honest answer: under this cascade’s actual decision conditions, sensor expansion doesn’t change the decision. That negative is the finding, and the finding shapes the investment recommendation.
How we built it
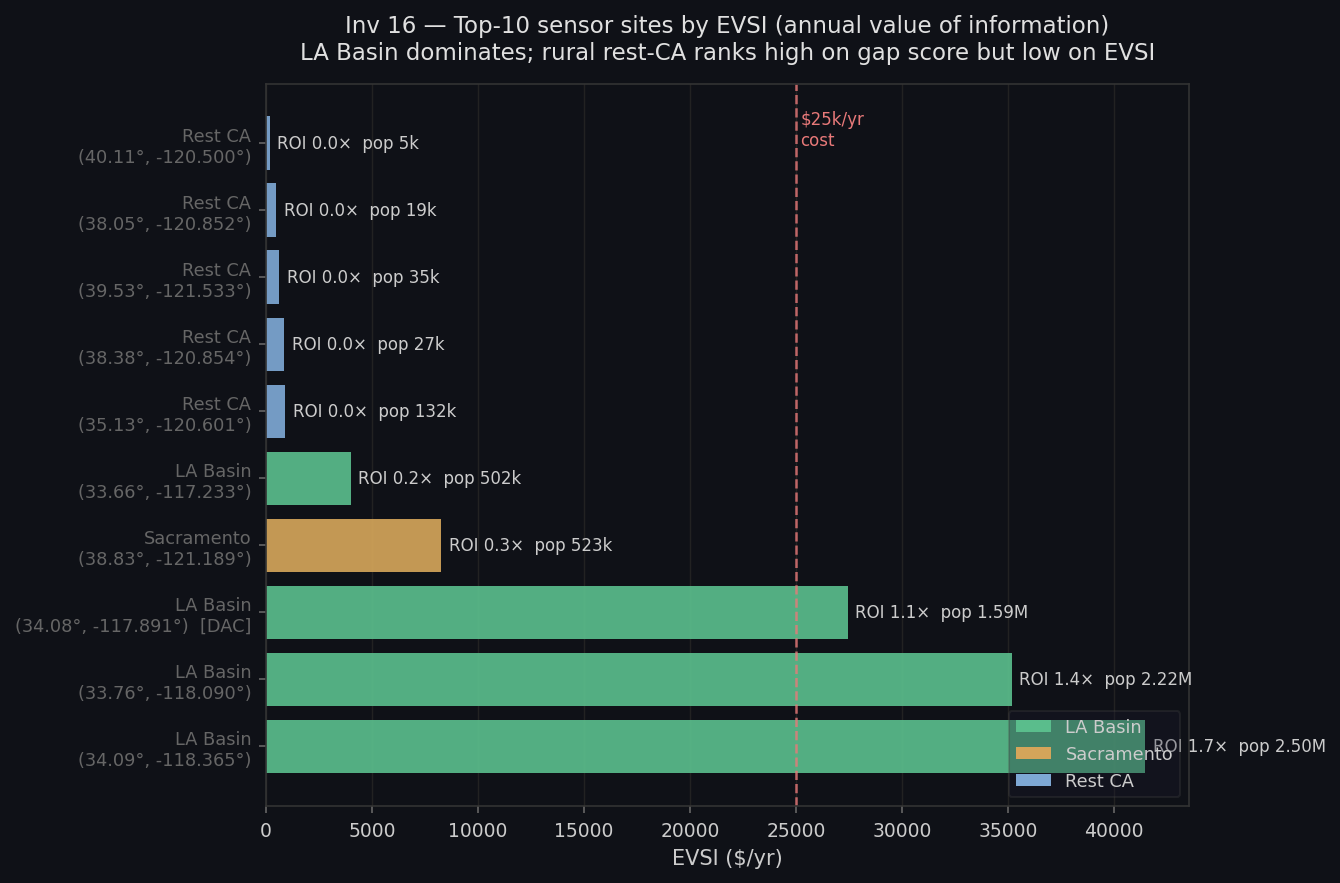
We started with a static foundation and built toward a decision-theoretic conclusion. The per-cell value map covers all 21,164 California grid cells, weighting each by population burden, baseline mortality, PM2.5 concentration, and distance to the nearest of 520 active monitoring sites. The gap between coverage-optimal and decision-optimal placement is stark: coverage-optimal puts the top sensor 241.7 km from any existing monitor, in an unpopulated wilderness cell. Decision-optimal puts it 8.2 km from an existing monitor, in a dense LA Basin cell. 233 kilometers apart, no population overlap.
The sequential deployment investigation tests four strategies for a five-monitor budget over five years: static top-N, greedy sequential, Bayesian optimization, and a climate-fire-informed adaptive strategy. No single strategy dominates all objectives. The climate-informed adaptive strategy leads on ROI (9.42×, $117.8M total value); the static top-N leads on DAC equity (40.0% of placements in disadvantaged communities). Bayesian optimization matches greedy on value while achieving top-N equity — a strict upgrade. A cost-aware multi-fidelity screening approach then shows how to identify the right sites before committing, recovering 4 of the top 5 oracle sites at 3.3× lower evaluation cost and only 2% value loss.
Bayesian sensor fusion combines 112 active monitoring stations with the air quality model via kriging and a Gaussian update. The fused surface outperforms either the model alone (by 4.4% RMSE) or kriging alone (by 6.2%) in leave-one-out cross-validation, confirming that combining the two genuinely adds information rather than just correcting a biased starting point. The cross-validation that closes this element tests all four strategies plus dose-response tightening against a single shared metric: does any of them change which portfolio we recommend? At the canonical conditions ($250M flip threshold, 5,000 draws, current dose-response width), all strategies produce $0 decision value. Only in a hypothetical scenario with twice the dose-response uncertainty and a tighter decision threshold does sensor fusion register non-zero value — $0.17B.
What we found
Load-bearing negative result: sensor VOI is $0 at the canonical decision cell
Across all four strategies (adaptive placement, BOCA screening, sensor fusion, CRF tightening), headline VOI against the Investigation M-1 portfolio decision is $0.000B at the default cell (5,000 MC draws, $250M flip threshold, 1.0× CRF posterior width). The Investigation M-1 prior already concentrates around A_free_lunch ($0.68B expected net benefit, well clear of all negative-NB alternatives) strongly enough that no additional PM2.5 measurement shifts the decision above the relevance threshold. This is a finding, not a failure. Running the full decision pipeline end-to-end is the only way to reach this conclusion; the individual investigations (Investigation 8-1, 27, 32, 38) cannot see it without Investigation 8-5.
Sensor VOI becomes real only in the loose-CRF / tight-decision regime: $0.17B
When the CRF posterior is twice as wide as Investigation 6-3’s hierarchical estimate (2.0× σβ) and the decision threshold is tightened to $50M, Investigation 8-4 sensor fusion leads with $0.17B VOI; Investigation 8-3 BOCA placement second at $0.13B. This is the regime where CRF uncertainty is large enough that emission-field precision shifts portfolio rankings. It is a hypothetical robustness check, not the current operating condition.
Decision-theoretic vs. coverage-optimal placement: 233 km apart, zero population overlap
The kriging-optimal sensor (maximum distance from existing monitors, 241.7 km, population 0) and the decision-optimal sensor (maximum gap score, 8.2 km from an existing monitor, population 4,369) are 233 km apart and share no population served. Agencies that design monitoring networks by spatial coverage criteria put sensors where no one lives. Investigation 8-1 makes this tradeoff numerically explicit for all 21,164 California grid cells.
Climate-informed adaptive placement leads on ROI at 9.42×; static top-N leads on equity
The POMDP-coupled adaptive placement strategy (Investigation 8-2 L4) delivers $117.8M EVSI against a $12.5M cost for five monitors over five years. L1 static top-N leads on DAC equity (40.0% of placements in disadvantaged communities, vs. 20% for greedy L2). L3 Bayesian optimization matches L2’s EVSI but achieves L1’s DAC equity, demonstrating that Bayesian optimization is a strict equity upgrade over greedy at equal total EVSI.
Cost-aware multi-fidelity screening: 3.3× speedup at 2% value loss
Investigation 8-3’s cost-aware screening recovers 4 of the oracle’s 5 top sites at 1.5 evaluation-cost units vs. 5.0 for full simulation (3.3× speedup), with only a 2% EVSI gap. The full-simulation tier was never needed: cheap gap-score screens and medium-cost climate-UCB evaluations resolved all five commitment decisions. The missed oracle site (sjv_cell9709) was eliminated by a single noisy fid-1 draw — the canonical successive-halving failure mode, documented transparently.
Bayesian sensor fusion reduces PM2.5 uncertainty 24.8%, confirms model calibration
After AQS-anchored rescaling of the ISRM prior, the fused model + monitor surface outperforms both model alone (4.4% RMSE reduction) and kriging alone (6.2% RMSE reduction) in leave-one-out cross-validation across 112 CA AQS sites. Mean posterior standard deviation falls from 0.81 to 0.68 µg/m³ (24.8% uncertainty reduction); cells near monitors reach 98.1% variance reduction. The post-rescale result is cleaner than the pre-rescale story: fusion adds genuine marginal information rather than correcting a biased prior.
Investigations
Monitor VOI Map
Per-cell Monitoring Value Index across 21,164 CA grid cells; EVSI per candidate sensor at top-10 sites; kriging vs. decision-theoretic placement comparison; DAC equity of gap-score-driven network design.
Monitor Adaptive
Five-rung fidelity ladder for five-monitor sequential deployment: L1 static, L2 greedy, L3 GP Bayesian optimization, L4 POMDP-coupled (climate-fire informed), L5 multi-pollutant co-location. No single strategy dominates all criteria.
Monitor Multifidelity
BOCA-inspired multi-fidelity cost-aware screening over 16 candidate sites: 3.3× speedup vs. full-simulation UCB at 2% EVSI loss; 4/5 oracle overlap; fid-1 + fid-3 path resolved all decisions without requiring the full-simulation tier.
Sensor Fusion Bayesian
Gaussian Bayesian fusion of ISRM model prior and 112 AQS FRM/FEM annual-mean monitors via ordinary kriging + precision-weighted Bayesian update; LOO cross-validation; regional discrepancy map; health-impact comparison (fusion vs. model-only PM2.5 field).
Sensor Strategy Cross Validation
Cross-validation of all four sensor/CRF strategies against the Investigation M-1 portfolio decision on a single VOI metric. 27-cell parameter sweep (MC budget × decision threshold × CRF width). Load-bearing finding: $0 VOI at canonical cell; $0.17B (Investigation 8-4 fusion) in loose-CRF / tight-decision regime only.
How it connects to the rest of the cascade
The negative finding sharpens the investment question, it doesn’t undermine the methodology. All sensor strategies produce $0 decision value at canonical conditions. The conclusion: additional PM2.5 measurement buys precision, not decisions. The decision-relevant uncertainty is in the dose-response function, not the emission field. Investment belongs in Element 6 (resolving dose-response uncertainty) rather than sensor expansion. The cross-validation proves that claim against the actual decision menu rather than asserting it.
The per-cell value map feeds Element 5 (DAC equity analysis) directly. Decision-theoretic value scores under the air quality model do not naturally concentrate in disadvantaged communities — only 1 of the top-10 candidates is DAC-designated. That is the evidence base for treating equity as an explicit constraint in any monitoring expansion, not a byproduct of value optimization.