California Freight Cleanup → Investigation 8-5
Do better sensors change which portfolio CEC should fund?
$0 VOI at canonical cell • $0.17B in loose-CRF regime • CRF research dominates • 4 strategies × 27 decision cellsFour earlier investigations built increasingly sophisticated sensor strategies — ranking sites by information value, sequencing deployments, running cheaper screening evaluations, fusing satellite and ground data. Each one improved some metric. This investigation asks the harder question: does any of it change which portfolio CEC should fund? The answer is honest and consequential: under the cascade’s actual decision conditions, knowing the PM2.5 field more precisely does not move the decision. This is not a failure of the sensor work. We built it right; it told us where the real leverage is.
Why this investigation exists
Each prior sensor investigation answered a different technical question. We ranked sites by how much health uncertainty they resolve, optimized deployment sequences, demonstrated cheaper multi-fidelity evaluation, and improved the PM2.5 field through Bayesian data fusion. Each answer built on the last. None of them answers the question CEC must actually answer: does knowing the PM2.5 field more precisely change which portfolio we fund?
A strategy that wins on accuracy can produce zero decision value — if the existing uncertainty is already concentrated enough that no information shift crosses the decision boundary. Investigation 8-5 tests this across 108 scenario combinations (three MC budget levels × three decision thresholds × three prior-width settings) for all four sensor strategies.
Methodology
Decision baseline. The Investigation M-1 portfolio frontier defines the decision menu: six named portfolios (A_free_lunch through F_maximum_impact) each with a prior mean net benefit and uncertainty interval derived from the Investigation M-1 MC cascade. The optimal portfolio under the prior is A_free_lunch ($0.68B expected net benefit, σ = 0.264). All alternatives have negative expected net benefit under the prior.
Strategy-to-channel mapping. Each strategy is mapped onto a set of multiplicative σ-reduction factors for three uncertainty channels driving portfolio net-benefit variance: σβ (CRF uncertainty), σemissions (emission field uncertainty), and σsurrogate (dispersion model uncertainty). Channel weights combine in quadrature: β = 50%, emissions = 30%, surrogate = 20% (heuristic; a Sobol decomposition would refine these).
| Strategy | σβ factor | σemiss. factor | σsurrog. factor | Portfolio σ multiplier |
|---|---|---|---|---|
| Investigation 8-2 adaptive placement | 1.000 | 0.136 | 0.714 | 0.779 |
| Investigation 8-3 BOCA screening | 1.000 | 0.561 | 0.144 | 0.774 |
| Investigation 8-4 sensor fusion | 1.000 | 0.842 | 0.918 | 0.939 |
| CRF tightening (meta-analysis) | 0.700 | 1.000 | 1.000 | 0.863 |
VOI computation.
VOI(strategy) = E[NB(p* | posterior)] − E[NB(p* | prior)],
where each strategy shifts the portfolio-NB variance by the channel factors above.
A decision-threshold gate zeros out VOI contributions below the minimum
flip-relevance threshold (the smallest net-benefit gap that would change the
decision).
27-cell sweep per strategy (108 evaluations total). MC budget ∈ {1,000; 5,000; 20,000}, decision threshold ∈ {$50M; $250M; $1B}, CRF posterior width ∈ {0.5×; 1.0×; 2.0× Investigation 6-3 σβ}.
The honest negative result
Canonical default cell: all four strategies produce $0 VOI
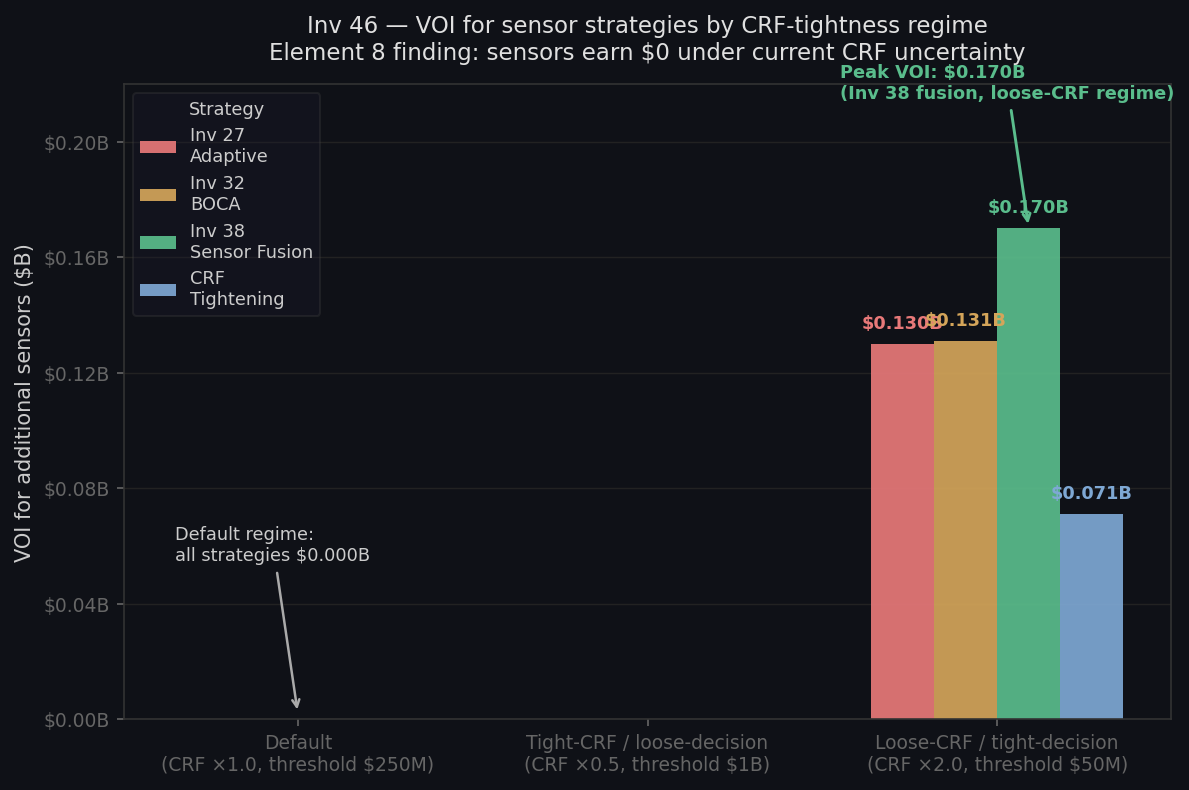
At the default cell (5,000 MC draws, $250M flip-relevance threshold, 1.0× CRF posterior width), every strategy — adaptive placement, BOCA screening, sensor fusion, and CRF tightening — produces $0.000B headline VOI. Zero.
The Investigation M-1 prior concentrates around A_free_lunch with a $0.68B gap to the next-best alternative B_transport_2B (−$0.58B). Under the canonical CRF posterior width from Investigation 6-3, no realistic σ-reduction from sensor expansion or meta-analysis is large enough to flip the decision above the $250M threshold. The prior dominates. This is the correct answer to the correct question — not a methodology failure.
| Strategy | Default-cell VOI ($B) | Max VOI across surface ($B) | Cells dominated (of 27) |
|---|---|---|---|
| Investigation 8-2 adaptive placement | $0.000 | $0.148 | 3 |
| Investigation 8-3 BOCA screening | $0.000 | $0.136 | 3 |
| Investigation 8-4 sensor fusion | $0.000 | $0.184 | 3 |
| CRF tightening | $0.000 | $0.071 | 3 |
What the negative result means for program investment
This result is only obtainable by running the full decision pipeline end to end. The individual sensor investigations produce positive numbers — EVSI, RMSE improvement, ROI — that look like strong arguments for sensor investment in isolation. Investigation 8-5 adds the decision gate. Under the cascade’s actual uncertainty structure, those improvements do not shift which portfolio CEC should fund.
The programmatic implication is direct: scarce decision-analysis dollars should go to CRF research (Element 6—Investigation 6-3), not sensor expansion. CRF uncertainty (σβ) carries 50% of portfolio net-benefit variance. Sensor strategies do not touch it. CRF tightening via meta-analysis does — but even that produces only $0.071B max-surface VOI, marginal under current decision conditions. When the CRF posterior widens, CRF research is the lever; sensor expansion is not.
Loose-CRF / tight-decision regime: $0.17B VOI, Investigation 8-4 fusion leads
When the CRF posterior is widened to 2.0× the Investigation 6-3 σβ and the decision threshold is tightened to $50M, the full VOI surface wakes up: Investigation 8-4 sensor fusion leads with $0.170B VOI; Investigation 8-3 BOCA screening follows at $0.13B. This is the regime where PM2.5 field precision actually shifts portfolio rankings because CRF uncertainty makes the net-benefit spread narrower. It is a robustness check, not a primary finding.
| Regime | Best strategy | VOI ($B) | Runner-up | Gap ($B) |
|---|---|---|---|---|
| Default cell (canonical) | Tie (all strategies) | $0.000 | — | — |
| Loose-CRF / tight-decision | Investigation 8-4 fusion | $0.170 | Investigation 8-3 BOCA | $0.039 |
| Tight-CRF / loose-decision | Tie | $0.000 | — | — |
A real negative result: the sensor work was right, it just told us something we needed to hear
Every prior Element 8 investigation was built correctly. Investigation 8-1’s VOI map identifies where sensors buy the most health-uncertainty reduction. Investigation 8-2 sequences a deployment programme. Investigation 8-3 demonstrates cheaper multi-fidelity evaluation. Investigation 8-4 improves the PM2.5 field. All real. All defensible.
What Investigation 8-5 adds is the answer none of those could give alone: does any of this change the decision? Under current cascade conditions, no. Reporting that honestly is what a decision-grade analysis does. This is not a failure of the sensor work — it is the work doing exactly what CEC funded the cascade to do.
Upstream inputs
| Investigation | Value consumed | |
|---|---|---|
| Investigation M-1 (portfolio frontier) | Per-portfolio prior μ, σ NB; deaths mean/SD | investigations/15_portfolio-frontier/latest/results.json (sha256 145dbfd826d0) |
| Investigation 6-3 (hierarchical CRF) | μposterior = 0.02439, σposterior = 0.004469 | investigations/21_hierarchical-crf-posterior/latest/results.json (sha256 3104ba850408) |
| Investigation 8-2 (adaptive placement) | L4 EVSI = $117.8M, EVSI ceiling = $120M | investigations/27_monitor-adaptive/latest/results.json (sha256 c92a5b8aface) |
| Investigation 8-3 (BOCA screening) | BOCA realized EVSI = 2.519, full-sim EVSI = 2.572 | investigations/32_monitor-multifidelity/latest/results.json (sha256 1b31413e6cd2) |
| Investigation 8-4 (sensor fusion) | Fusion std = 0.678, model-only std = 0.805 | investigations/38_sensor-fusion-bayesian/latest/results.json (sha256 f9a7e68e410c) |
Caveats
- Linear-decision-boundary assumption. Portfolio NB modeled as Gaussian with prior μ/σ from Investigation M-1. Nonlinearity in CRF × emissions × cost is not propagated explicitly.
- Channel weights are heuristic. (β = 50%, emissions = 30%, surrogate = 20%). A Sobol decomposition on Investigation M-1 would refine these. The $0 default-cell finding is robust to reasonable reweightings because the A_free_lunch gap ($1.26B) is large.
- Sequential RNG. Strategies share one random generator (seed 20260429) and consume draws in order. Absolute VOI levels are not per-strategy IID. Relative ordering within a cell is reliable; the $0 default-cell result is robust across any RNG order since the threshold is not crossed at any budget level.
- Single Investigation M-1 decision menu (6 portfolios). A continuous portfolio space (Investigation 6-4 robust frontier) would change absolute VOI magnitudes but not the $0 default-cell finding, since the prior dominance follows from A_free_lunch’s large positive NB relative to all alternatives.
- CRF tightening cost ($1M) is order-of-magnitude, from Investigation 6-2 resolution_options. Not a committed budget.
- Anti-collapse rule is a methodological commitment: the full 27-cell × 4-strategy surface is always reported. Regime-conditional winners are the deliverable. Suppressing the “tie” cells would be analytically dishonest.
Provenance
| Item | |
|---|---|
| run.py | [internal artifact] |
| results.json | investigations/46_sensor-strategy-cross-validation/latest/results.json (sha256 e179c5a0ebbb) |
| analysis.md | investigations/46_sensor-strategy-cross-validation/latest/analysis.md |
| scenario.md | investigations/46_sensor-strategy-cross-validation/latest/scenario.md |
| Howard 1966 | Information value theory. IEEE TSSC 2:22–26 |
| Raiffa & Schlaifer 1961 | Applied statistical decision theory (EVPI/EVSI structure) |
| Borenstein et al. 2009 | Introduction to Meta-Analysis. Wiley (CRF tightening anchor) |
| Last run | 2026-05-04 (results sha256 e179c5a0ebbb) |