California Freight Cleanup → Element 5
Where do the health benefits actually land?
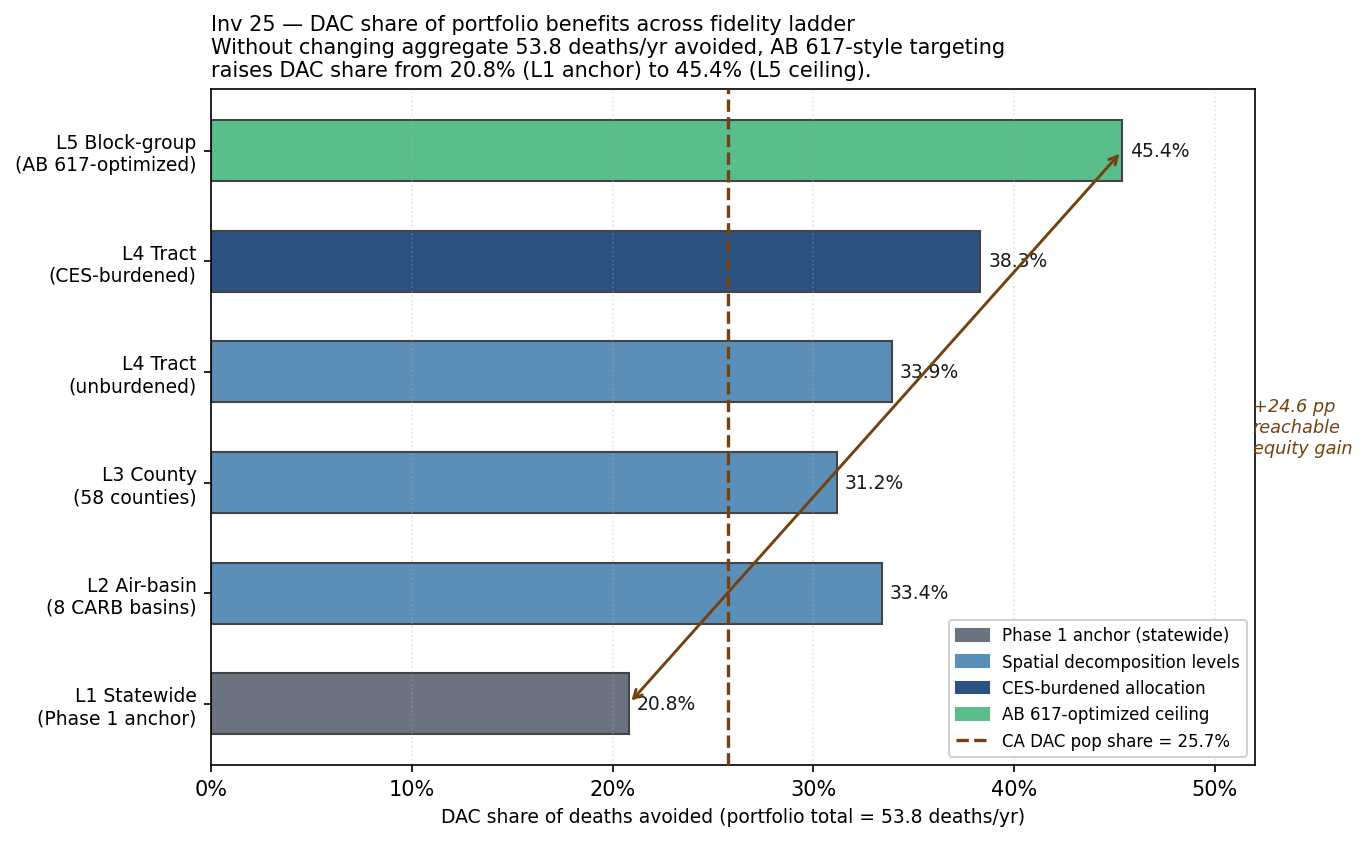
The default cleanup delivers 20.8% of its benefits to disadvantaged communities — 4.9 percentage points below their share of the population. We traced the 53.8 deaths avoided per year through five levels of geographic detail — statewide, air-basin, county, census-tract, block-group — while holding the total benefit constant. With AB 617-style targeting, the disadvantaged-community share can rise to 45.4% without sacrificing the overall life-saving total.
→ Decision Dashboard — compare portfolios across CRF anchors and budget scales.
What the question required
Any serious program justification needs DAC vs. non-DAC breakdowns on health outcomes at census-tract resolution — not statewide averages. It also needs to answer whether the benefits flip sign between the two groups, and whether the equity gap can be closed without sacrificing total health gains. A single point-estimate DAC share collapses the moment someone asks for a confidence interval. We built a spatially-resolved decomposition across five levels of geographic detail that feeds the ratepayer-burden analysis directly.
How we built it
We anchored on the zero-cost baseline: transport ACC II compliance plus building current-policy enforcement plus DTE Stockton biomass retirement, which together avoid 53.8 deaths per year at zero net program cost. The proportionality benchmark is 25.7% — the fraction of California’s 39.2 million residents who live in disadvantaged communities (OEHHA CalEnviroScreen 4.0; 2,936 of 9,100 census tracts). At each geographic level we computed what share of the aggregate mortality benefit actually lands in those communities, using per-basin NOx emissions shares for the four data-rich air basins and population-fraction splits for the rest. Two endpoints bracket the defensible range: CalEnviroScreen burden weighting (Morello-Frosch 2011) as the floor, and an AB 617-style 1.70× DAC targeting factor as the ceiling. Every level preserves the 53.8-death total. No additional spending assumed at any level.
What we found
The unmodified free-lunch portfolio delivers 20.8% of its benefits to DAC residents — 4.9 pp below the 25.7% parity benchmark
At statewide resolution (L1), 11.2 of the 53.8 deaths avoided per year land in the 25.7% of California that lives in disadvantaged communities. The gap — 20.8% delivered vs. 25.7% proportional — is structural: the portfolio’s transport and building scenarios track population-weighted NOx emissions, which correlate imperfectly with cumulative environmental burden. No portfolio restructuring is required to close it. Only targeting.
San Joaquin Valley is the equity bottleneck: highest DAC share (52.0%) and highest per-capita death rate (2.2/million residents), but only 17.7% of total portfolio volume
Air-basin decomposition (L2) reveals that South Coast (LA Basin) accounts for 43.5% of all deaths avoided (23.4 deaths) while SJV captures only 17.7% (9.5 deaths). Yet SJV residents bear the highest per-capita mortality benefit rate in the state and the state’s highest DAC population share. Any portfolio modification that redirects volume toward SJV improves equity efficiency disproportionately.
CalEnviroScreen burden weighting lifts the DAC share from 33.9% to 38.3% without changing the aggregate — an extra 2.4 deaths routed to DAC tracts
At census-tract resolution (L4), applying the Morello-Frosch CES-burdened weighting (1 + 0.5 × CES/100) shifts 2.37 additional deaths of benefit toward the 2,936 DAC tracts. The 38.3% burdened share is the highest defensible estimate reachable without changing portfolio composition or spending — the equity floor for any CEC program design discussion.
AB 617-style targeting can reach 45.4% DAC share — a 24.6 pp gain and 13.2 additional DAC deaths avoided — while preserving the 53.8-death aggregate
Block-group equity-weighted redistribution (L5) at a 1.70× DAC uplift factor raises the DAC share to 45.4%, recovering 13.2 additional DAC deaths avoided relative to the Phase 1 L1 anchor. This is a ceiling for a feasible community-targeting program — not an expected value. The key result: the aggregate mortality benefit and the equity objective are not in tension. The same 53.8 deaths can be concentrated toward the most-burdened communities through targeting alone.
County Gini (0.084) confirms the benefit distribution tracks population, not a concentrated-spillover problem
At county resolution (L3), the Gini coefficient over deaths-per-capita is 0.084 — near uniform. The top-5 counties account for 52.6% of benefits, consistent with their population share. This rules out the concern that benefits are being harvested by a few dense counties at the expense of rural or desert communities.
Investigations
How it connects to the rest of the cascade
This investigation sits at a dependency junction — reading from three upstream elements and producing the equity bounds the ratepayer-benefit analysis depends on.
-
Upstream: Element 1 (transport and building scenarios).
Per-intervention deaths-avoided totals (T1 transport: 13.1 deaths,
B1 building: 37.0 deaths, DTE Stockton biomass: 3.73 deaths) are
read from Investigation 15
(portfolio frontier) via
upstream_value. Any revision triggers a stale-upstream flag and forces re-interpretation. - Upstream: Element 2 (gas EGU siting). Investigation 8 (gas plant siting) contributes the DTE Stockton biomass-retirement scenario; its per-intervention deaths-avoided figure propagates through Investigation 15 into the Investigation 5-1 anchor.
-
Upstream: Portfolio construction.
The Phase 1 DAC share (0.208) is read from
Investigation 23 (robust portfolio optimization)
via
upstream_value("23", "portfolios.A_free_lunch.dac_share"). - Downstream: Element 6 (ratepayer burden / portfolio net benefit). The L4-burdened DAC share (0.383) and the L5 equity-optimized ceiling (0.454) feed Investigation 29 (NSGA-II Pareto equity optimization) as the equity objective bounds. Element 6’s ratepayer narrative uses them to frame whether the free-lunch portfolio delivers proportionate DAC benefit or requires targeting modifications.