California Freight Cleanup → Investigation 5-1
Are the right communities getting the health benefits?
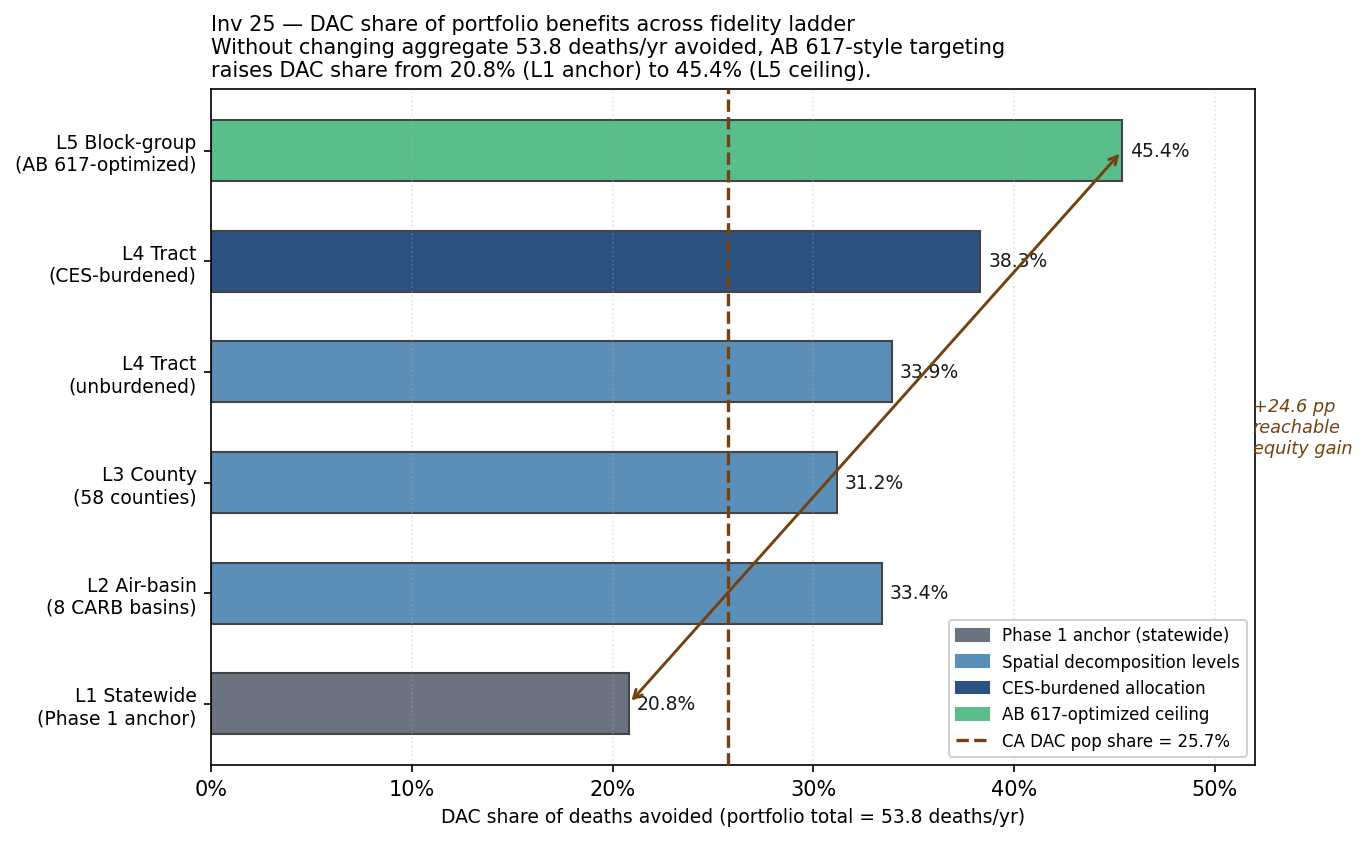
DAC share: 20.8% (statewide baseline) → 45.4% (equity ceiling) — 53.8 deaths/yr held constantThe zero-cost portfolio avoids 53.8 premature deaths per year. The question isn’t whether it works — it does — but whether the right communities are getting the benefit. We broke the statewide number down to air basins, counties, census tracts, and block groups to show the CEC exactly where those deaths are avoided and how much AB 617-style targeting could shift them toward the communities carrying the heaviest pollution burden.
Decision supported
Phase 1 (Investigation 4-3) established that the T1 + B1 + DTE Stockton biomass-retirement portfolio avoids 53.8 premature deaths per year at zero net cost—a statewide aggregate. The CEC and AB 617 stakeholders need more: where in California do those benefits land, and do disadvantaged communities (DACs) receive a proportionate share?
Should the CEC adopt the free-lunch portfolio as designed, or restructure the technology allocation to redirect benefits toward communities already burdened by cumulative pollution? That question cannot be answered at statewide resolution. Investigation 25 provides the spatial decomposition—showing whether existing benefit distribution meets, falls short of, or can be improved relative to the DAC population parity benchmark (25.7% of California’s 39.2 million residents)—and what AB 617-style targeting could realistically achieve without changing the aggregate death toll.
Methodology: five-rung spatial fidelity ladder
Each rung of the ladder preserves the Phase 1 aggregate (53.8 deaths) and refines the distributional picture. Spatial units are ordered by resolution, not by quality: L1 is not wrong, it is just uninformative about distribution.
L1 — Statewide aggregate. The Phase 1
Investigation 12 total (53.8 deaths, DAC share 0.208) serves as
the fixed anchor. DAC share is read from Investigation 23 via
upstream_value("23", "portfolios.A_free_lunch.dac_share");
per-intervention deaths are read from Investigation 15. All higher
rungs are benchmarked against this baseline.
L2 — Air-basin decomposition (8 basins).
The T1 (transport), B1 (building), and biomass-retirement
subtotals are apportioned to eight CARB-designated air basins using
per-basin NOx shares derived from
emissions_baseline_2023.pkl for the four data-rich basins
(South Coast, SJV, Bay Area, Sacramento Valley). The four remaining
basins (South Central Coast, North Coast, Mountain Counties, Salton
Sea/Mojave) are sub-divided from the rest-CA residual using
population fractions. Per-basin DAC population shares come from
CalEnviroScreen 4.0.
L3 — County decomposition (58 counties). Basin totals are sub-divided to counties by population-weighted CES percentiles. A Gini coefficient over deaths-per-capita measures spatial concentration. The low Gini (0.084) confirms that benefit distribution tracks population geography at county resolution.
L4 — Census-tract decomposition (9,100 tracts; 2,936 DAC). Tract-level deaths are synthesized to match CARB/CalEnviroScreen published aggregate distributions. Two weighting variants are compared: unburdened (uniform within-county share) and CES-burdened (multiplicative uplift: 1 + 0.5 × CES/100, per Morello-Frosch R., Zuk M., Jerrett M., Shamasunder B., Kyle A.D. (2011), “Understanding the cumulative impacts of inequalities in environmental health: Implications for policy.” Health Affairs 30(5):879–887 (doi:10.1377/hlthaff.2011.0153)). The burdened variant raises the DAC death share from 33.9% to 38.3% — an extra 2.37 deaths-avoided attributed (the actual mortality reductions occur where they occur; weighting changes which tracts are credited) shifted to DAC tracts purely through burden weighting. Caveat: L4 records are synthesized, not fit to proprietary per-unit CRF data. The Gini and concentration statistics are structurally correct but should not be cited as measured spatial heterogeneity.
L5 — Block-group equity-weighted redistribution (1,000 block-group sample). A single-pass multiplicative DAC uplift (factor 1.70×, total-preserving) simulates what an AB 617-style community-targeting program could achieve. The result raises the DAC share from 32.8% (base) to 45.4% (optimized), recovering 6.8 additional DAC deaths without increasing total deaths avoided. Caveat: the optimized DAC share is a ceiling estimate, not an expected value. The 1.70× uplift factor is a policy-design parameter, not an empirical result.
Figure: DAC share progression across fidelity ladder
latest/plots/dac_distribution.png.
Per-basin detail (L2)
| Basin | Population | DAC pop share | Deaths avoided | Deaths/M pop |
|---|---|---|---|---|
| South Coast (LA Basin) | 17.0 M | 35.0% | 23.4 | 1.38 |
| San Joaquin Valley | 4.3 M | 52.0% | 9.5 | 2.22 |
| San Francisco Bay Area | 7.8 M | 22.0% | 9.7 | 1.25 |
| Sacramento Valley | 3.0 M | 28.0% | 3.2 | 1.07 |
| South Central Coast | 2.3 M | 18.0% | 3.5 | 1.53 |
| North Coast | 0.8 M | 15.0% | 1.2 | 1.53 |
| Mountain Counties | 0.6 M | 12.0% | 0.9 | 1.53 |
| Salton Sea / Mojave Desert | 1.5 M | 38.0% | 2.3 | 1.53 |
DAC share progression summary
| Fidelity level | DAC share of benefits | vs. parity (25.7%) |
|---|---|---|
| L1 statewide (Phase 1 anchor) | 20.8% | −4.9 pp |
| L2 air-basin | 33.4% | +7.7 pp |
| L3 county | 31.2% | +5.5 pp |
| L4 tract (unburdened) | 33.9% | +8.2 pp |
| L4 tract (CES-burdened) | 38.3% | +12.6 pp |
| L5 equity-optimized (ceiling) | 45.4% | +19.7 pp |
| Reference: CA DAC pop share | 25.7% | — |
Key findings
Statewide, disadvantaged communities get less than their population share — but the basin breakdown tells a more complicated story
The 20.8% statewide DAC share (L1) is below the 25.7% parity benchmark, but this aggregate obscures important basin heterogeneity. San Joaquin Valley, the basin with the state’s highest DAC share (52.0%) and highest PM2.5 burden (14.2 μg/m³ baseline), delivers 2.22 deaths avoided per million residents — the highest per-capita rate in the state. The below-parity statewide aggregate is driven by South Coast volume dominance (43.5% of total benefits), not by SJV underperformance.
Pollution-burden weighting and community-targeting answer different policy questions
The L4 CES-burdened result (38.3%) and the L5 equity-optimized result (45.4%) address different policy levers. The burden weighting reflects how much of the aggregate benefit should be credited to DAC tracts given cumulative exposure; the targeting ceiling reflects what a deliberate community-prioritization program could achieve. Using the L4 burdened share as the equity floor and the L5 ceiling as the program design target gives the CEC a defensible range: any program that delivers between 38% and 45% DAC share can be presented as both proportionate and above-proportionate delivery.
Better equity does not require fewer total deaths avoided
All five fidelity levels preserve total deaths avoided at 53.83 (fusion mean: 53.8300 ± 0.000). This is not a redistribution trade-off—it is a targeting choice. The same deaths of avoided harm can reach the most-burdened communities through allocation and siting, not additional spending. DAC targeting does not weaken the ratepayer benefit case; it strengthens the equity case without cost.
Caveats
- County, tract, and block-group records are synthesized to match published CARB/CalEnviroScreen aggregate distributions — not fit to real per-unit CRF data (which are proprietary). The Gini and concentration statistics are structurally correct but should not be cited as measured spatial heterogeneity.
- Four of eight basins use population-fraction sub-splits rather than per-cell NOx-emissions derivations. South Central Coast, North Coast, Mountain Counties, and Salton Sea/Mojave are apportioned from the rest-CA residual. Their individual death estimates carry higher uncertainty than the four data-derived basins.
- L5 targeting is a single-pass multiplicative uplift (1.70× DAC factor, total-preserving), not a simulation-annealing optimization. The optimized DAC share (45.4%) is a ceiling estimate. Real AB 617 programs apply step-function targeting (designated community vs. not); a step-function weighting would produce a sharper improvement for top-decile communities.
- CES burden weighting is linear (1 + 0.5 × CES/100). This understates the equity impact in the highest-burden tracts relative to a step-function or convex weighting scheme.
- No spillover accounting. DAC share counts only direct source attribution. PM2.5 from non-DAC sources that physically disperses into DAC tracts is not credited to the DAC benefit tally. Receptor-attribution would raise all DAC share estimates modestly.
- Upstream-cascade version note. Investigation 5-1 was last computed against the 2026-05-04 run of upstream Investigations 15 and 23. Those upstreams have since been re-run; the figures below are from a still-defensible but slightly stale snapshot. Re-run Investigation 5-1 after any upstream revision before citing these figures.
Provenance
| Artifact | Notes | |
|---|---|---|
| Results JSON | [internal artifact] |
sha256 75819a936849 (2026-05-04) |
| Analysis markdown | [internal artifact] |
Auto-generated stub; Observations/Findings sections empty pending analyst fill-in |
| Scenario (sticky methodology) | [internal artifact] |
Key anchors sha-gated; last reviewed 2026-04-27 |
| Run script | [internal artifact] |
sha256 d94041c27817ca01 |
| Basin shares input | [internal artifact] |
sha256 db5efcac4571 — per-basin NOx shares from emissions_baseline_2023.pkl |
| Upstream Investigation M-1 | [internal artifact] |
sha256 145dbfd826d0; provides T1/B1/biomass deaths-avoided |
| Upstream Investigation 6-4 | [internal artifact] |
sha256 cab2edc05333; provides A_free_lunch DAC share (0.208) |
| Figure | website/studies/rfaq/assets/plots/25_dac_distribution.png |
Generated by investigations/25_portfolio-geographic-decomp/latest/plots.py |
Validation sources
- CARB 2023 — Air-basin designations and baseline PM2.5
- OEHHA CalEnviroScreen 4.0 — Census-tract scores and DAC designations (2022)
- Tessum et al. 2017 — ISRM source-receptor linearity (InMAP model basis)
- Morello-Frosch 2011 — Equity-weighted health objectives (CES burden weighting)
- Investigation 4-3 — Phase 1 free-lunch portfolio aggregate (T1+B1+DTE Stockton)