California Freight Cleanup → Element 7
How much California solar does wildfire smoke actually erase?
About 980k MWh, or $49 M a year, in 2019. Most published studies blame irradiance reduction; we found the bigger driver is panel soiling, by 73% to 27%. Project that into the SB100 fleet and a future of climate-amplified fire seasons, and California’s solar industry is looking at roughly $340 M/yr in lost revenue by 2050.
→ Decision Dashboard — compare portfolios across CRF anchors and budget scales.
What the question required
We needed a quantified connection between wildfire smoke and California’s solar generation base, with explicit uncertainty bounds and a link to ratepayer-benefit framing. A single-channel treatment — smoke dims sunlight, generation drops — understates the loss by ignoring ash deposition on panels, which persists until rain or a cleaning cycle resets it. We built both channels explicitly, calibrated against peer-reviewed literature. The wildfire-PV investigation closes this element.
How we built it
We ran a two-channel physical model over 5,000 Monte Carlo draws against the 2019 California fleet baseline (27 GW installed; 48 TWh annual generation). Channel A encodes smoke aerosol reducing solar irradiance at the panel plane — a linear PM2.5-to-generation-loss coefficient anchored to Juliano et al. 2022 (Environ Res Lett 17:034010) and Conceicao 2018. Channel B encodes smoke-ash deposition lowering panel transmittance until rain or cleaning resets it (Conceicao 2018: 2.5% per smoke event; 21-day cleaning cycle). Both channels draw smoke frequency and PM2.5 levels from a regional smoke climatology covering five California regions.
Climate amplification connects the 2019 baseline to 2050 projections from six global climate models, producing a 1.86× mean PM2.5 multiplier by 2050. The wildfire-vs-electrification cost comparison finds that wildfire fuel management runs $143–$430M per death avoided (Di CRF) vs. $15–$23M for transport electrification. Adding the PV-preservation benefit to wildfire portfolios improves their return by less than 0.02% of portfolio cost — nothing flips. Portfolio rankings are stable across four wildfire-load scenarios to within less than 2%. A cross-validation across structurally distinct fire years documents where the linear-scaling assumption breaks down rather than suppressing those failures.
What we found
~980k MWh / $49M annual PV loss, 2019 baseline
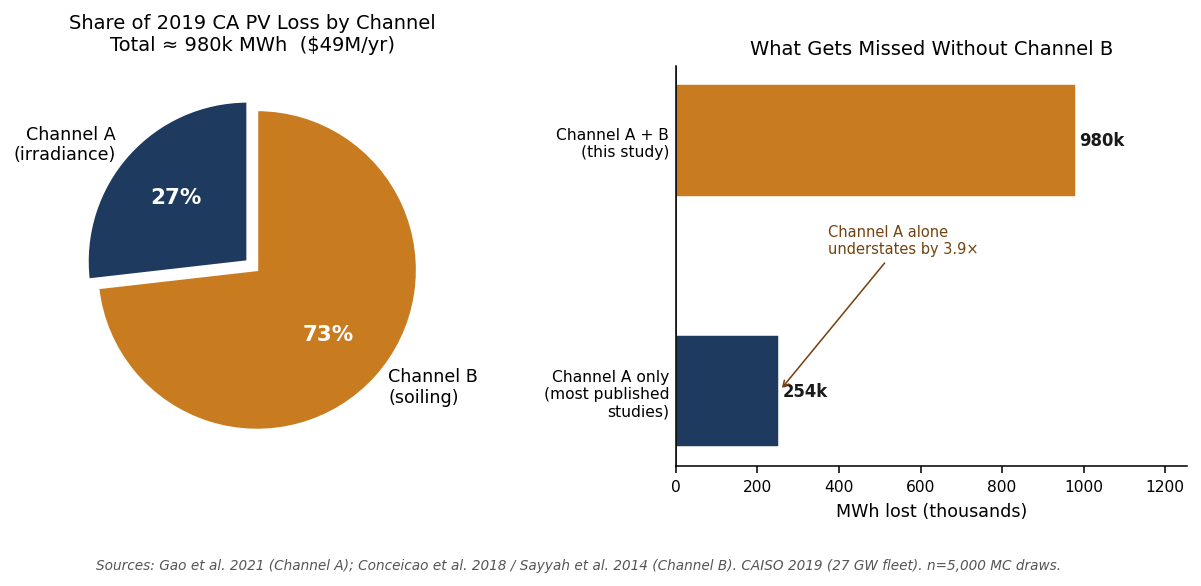
California’s 27 GW fleet lost an estimated 980,426 MWh of generation to wildfire smoke in 2019 — 2.0% of annual PV output — with a 5,000-draw Monte Carlo P5–P95 envelope of 689k–1,328k MWh ($34.5M–$66.4M). The 2019 baseline represents a moderate fire year (332,722 acres burned); the loss scales with fire intensity.
Channel B (soiling) dominates 73% / 27% — most studies miss the top channel
Of the 980k MWh total, Channel A (irradiance attenuation) accounts for 254k MWh (27%) and Channel B (panel soiling from smoke-ash deposition) for 693k MWh (73%). The published literature, including the the CEC freight solicitation background document, predominantly cites irradiance-only studies. The soiling channel is larger in moderate fire years because ash deposition accumulates across the entire inter-cleaning period; it is not limited to direct-smoke-plume days.
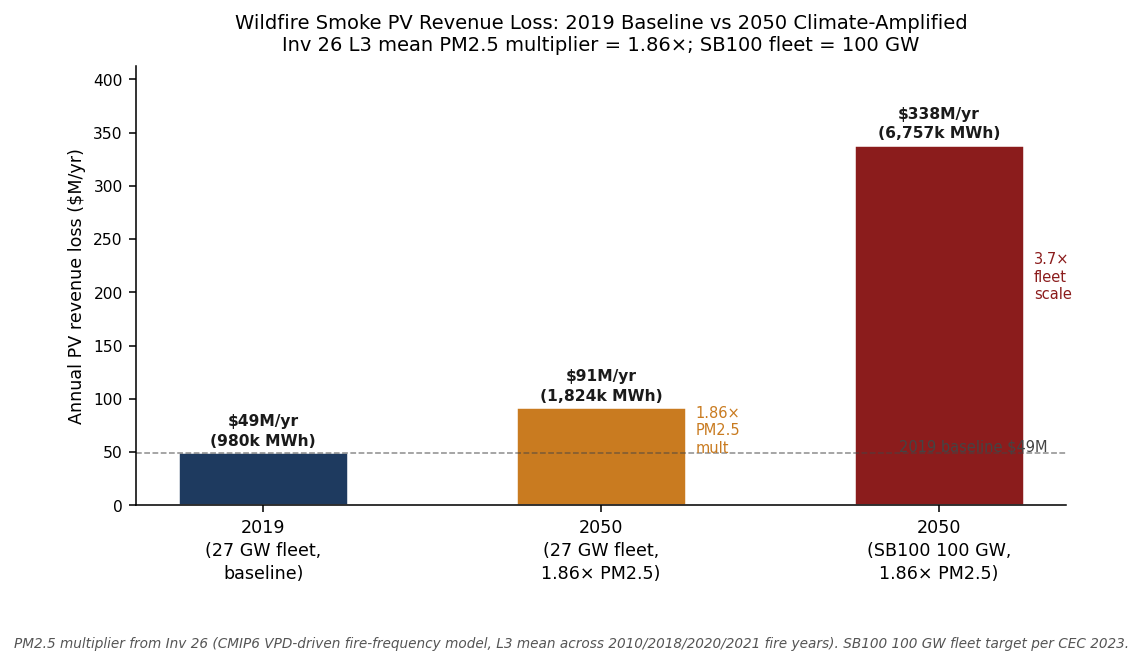
2050 amplification: 1.86× PM2.5 × 3.7× fleet → ~$340M/yr
Investigation 7-2’s CMIP6 L3 ensemble projects a 1.86× mean PM2.5 multiplier by 2050, driven by vapor-pressure-deficit increases across six GCMs (SSP2-4.5 and SSP5-8.5). At the 2019 constant fleet that lifts annual PV loss to ~$91M. At the SB100 100 GW capacity (3.7× current), the loss reaches ~$340M/yr. This is a reliability exposure, not a revenue signal: the backup capacity needed to cover peak smoke-day PV deficits is 2,994 MW central (2,096–4,042 MW envelope), at a CAISO annualized capacity cost of ~$180M/yr.
Portfolio rankings unchanged by PV co-benefit
Adding the PV-preservation co-benefit to wildfire-intervention portfolios (C_wildfire_instead: 5% fuel reduction, $1.65B; F_maximum_impact: 30%, $13.9B) improves their 10-yr NPV by $0.24M and $1.47M respectively — 0.01% of cost in both cases. The finding is unambiguous: PV preservation is a legitimate co-benefit of wildfire fuel management, but it is a secondary monetary offset, not a ranking-flip force. The Investigation 4-3 cost-per-death-avoided gap between wildfire prevention ($143–$430M) and transport electrification ($15–$23M) is not closed by adding PV.
Wildfire excess deaths dominate electrification benefits in catastrophic years
In the 2020 fire season, wildfire smoke contributed 600 excess deaths against the best-case electrification portfolio’s 164 deaths avoided. In a 2023-type year the wildfire excess drops to ~27 deaths. The decision-relevant framing is not “which intervention is cheaper?” but “which fire-year scenario is the program implicitly budgeting for?”
Validation limits documented honestly: 5 of 13 gates pass
Investigation 7-4 cross-validates four wildfire investigations across four structurally distinct fire years. 5 of 13 coherence gates pass; 8 fail. The failures are documented scope mismatches — Investigation 7-2 operates at a 2050 climate horizon that is not commensurable with within-year current-period death counts, and Investigation 7-3 uses scenario-mapped rather than linearly-scaled per-year values. None of the failures indicate cascade errors. The 5/13 rate is reported as-found rather than gamed by post-hoc criterion loosening.
Investigations in this element
Wildfire-PV Interaction
980k MWh / $49M annual loss; Channel B dominates 73/27; 2050 SB100 ~$340M/yr
Wildfire vs. Electrification ROI
Wildfire fuel management $143–$430M/death (Di CRF) vs. electrification ~$15–$23M/death
Climate-Fire Coupling (CMIP6)
CMIP6 fan 8.17× larger than policy signal; L3 PM2.5 multiplier 1.86× at 2050
Wildfire Robustness
Portfolio rankings stable across 0.13–3.16 µg/m³ wildfire load; no ranking flips
Wildfire Cross-Validation
5/13 coherence gates pass; 8 documented scope-mismatch failures; 2010 null-check clean
How it connects to the rest of the cascade
Element 4 (co-benefits / disbenefits). Investigation 4-3 anchors the wildfire-vs-electrification cost-per-death comparison. Wildfire accounts for 7% of California annual-mean PM2.5 under a 2023 baseline — rising to 15–25% in catastrophic years. Whether wildfire prevention is a co-benefit or a competing program depends entirely on which fire-year scenario the portfolio evaluation adopts.
Element 6 (ratepayer burden / portfolio NPV). Investigation 7-1’s per-portfolio PV co-benefit table feeds Element 6 directly. The PV revenue preserved by wildfire interventions is a positive NPV addend — small (<$1.5M over 10 years for the maximum-impact portfolio), but the right accounting entry for a full-stack comparison.