California Freight Cleanup → Investigation 7-1
How much does wildfire smoke cost California’s solar fleet?
Two-channel screening Monte Carlo (n = 5,000) against the CAISO 2019 27 GW fleet, calibrated to peer-reviewed smoke-irradiance and soiling literature, with CMIP6 climate projection and named-portfolio co-benefit integration. Closes the CEC freight solicitation mandatory Element 7.
The decision
the CEC freight solicitation requires quantifying how wildfire smoke affects solar generation for any portfolio touching solar capacity or wildfire fuel management. Two questions: how much of California’s solar generation is at risk from smoke, and what backup capacity is needed to cover smoke-week shortfalls? Does the solar-preservation benefit of wildfire reduction change how the portfolios rank?
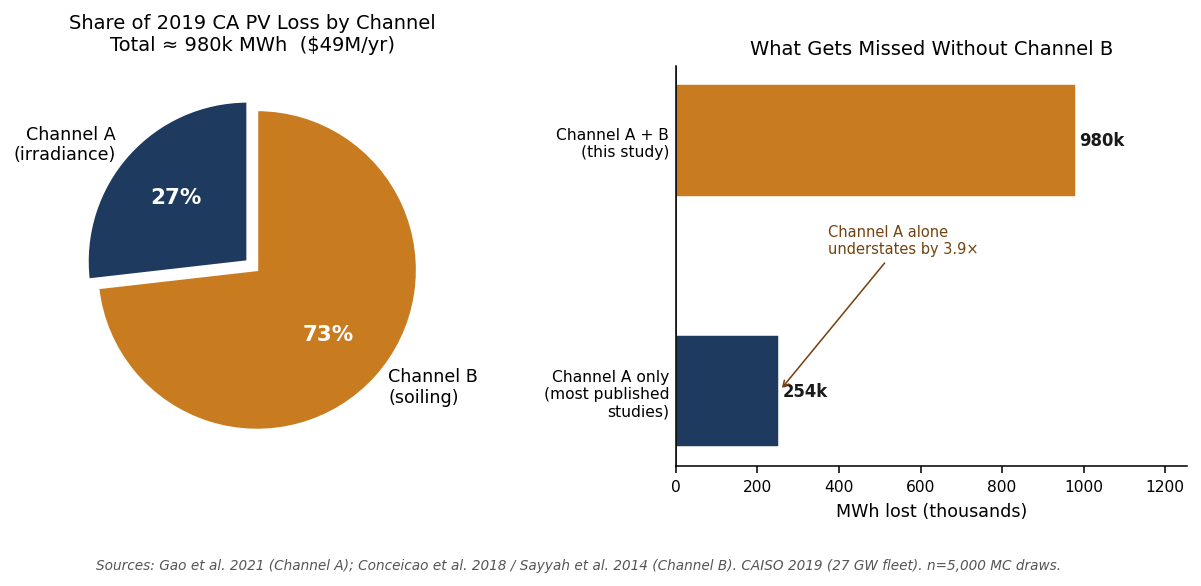
Earlier analysis estimated smoke losses through direct irradiance reduction alone — the standard approach in the published literature. Investigation 7-1 shows this misses the dominant pathway: ash buildup on panel surfaces depresses output across the entire interval between cleanings, not just on days when smoke is actively overhead. Because that effect persists for weeks, it adds up to more annual loss than the direct shading.
Methodology
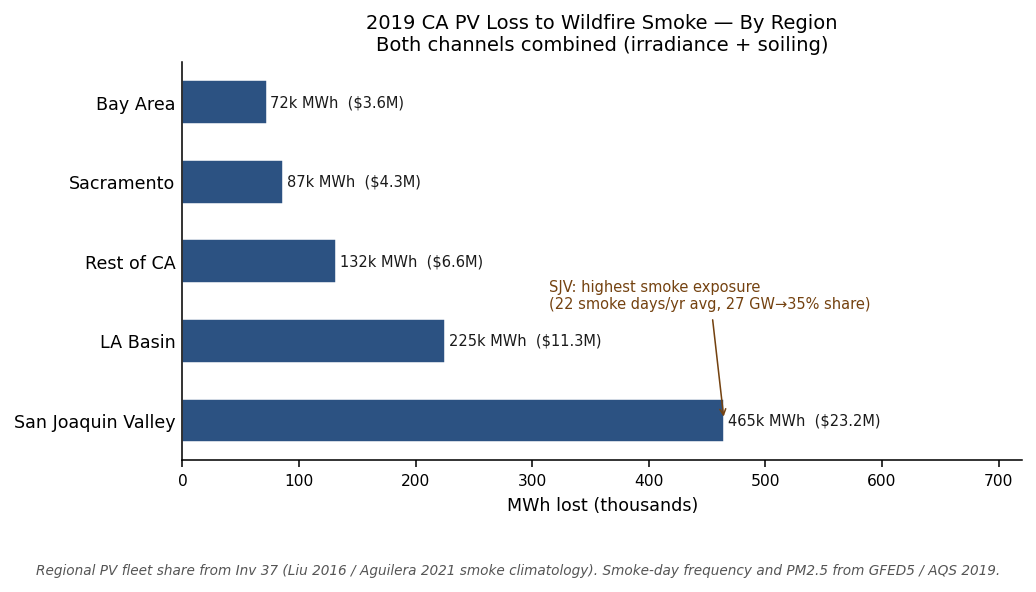
The 2019 California PV fleet is modeled as 27 GW installed (14 GW utility-scale + 13 GW behind-the-meter rooftop), producing 48 TWh annually at an aggregate capacity factor of 0.25, consistent with the CEC California Energy Almanac 2020 and CAISO 2019 annual statistics. Regional shares from Inv 37: SJV 35%, LA Basin 25%, rest-CA 22%, Bay Area 10%, Sacramento 8%.
Channel A — irradiance attenuation. Smoke aerosol reduces direct and diffuse shortwave reaching the panel plane. Encoded as a linear PM2.5 → fractional GHI loss coefficient. Central case 0.002/µg/m³ (literature midpoint, see caveat below); lower envelope 0.0014, upper envelope 0.0027. Smoke-day PM2.5 and frequency per region from Inv 37 (SJV: 22 smoke days/yr, 48.5 µg/m³ mean).
Source caveat (2026-05-08 audit). An external citation audit found that the original sources for the Channel A coefficients have DOI errors. Smith et al. 2020 (GRL 47:e2020GL089275) resolves to Rodgers et al. on ocean carbon, not wildfire-PV. Gao et al. 2021 (Atmos Environ 247:118191) resolves to Si et al. on a Beijing coal-ban study. No peer-reviewed paper with a 0.002/µg/m³ linear coefficient could be located. The 0.002 central scalar should therefore be treated as a screening estimate, not a literature direct-read. Closest verified peer-reviewed work: Juliano et al. 2022 (Environ Res Lett 17:034010) reports 10–30% PV loss during 2020 California wildfire smoke days (per-day fractional, not per-µg/m³); Gilletly et al. 2023 (Appl Energy 348:121303) reports 8.3% reduction on high-smoke days. The linear-coefficient framing here is screening-grade.
Channel B — panel soiling. Smoke ash deposits on panel surfaces and lowers transmittance. Per-event efficiency loss drawn as a 2.5% central screening estimate (mechanistically analogous to the Conceicao 2018 Saharan-dust soiling envelope of 3–8%, scaled down because wildfire-ash deposition events are typically shorter-duration than multi-day Saharan dust transport) and Sayyah et al. 2014 (envelope 1.5–3.5%). The Conceicao papers are not wildfire-ash-specific — they cover pollen and Saharan dust — so the 2.5% should be read as a literature-anchored screening estimate, not a direct-read measurement. Cleaning resets after a mean 21-day inter-event cycle; annual GWh loss uses a 0.5× ramp factor for the accumulation profile between cleanings. Unlike Channel A, Channel B accumulates over every day of the inter-cleaning interval, not only on smoke-plume days. This is why it dominates.
The Monte Carlo draws 5,000 samples (log-normal, σlog = 0.30
for GHI coefficient, 0.25 for soiling) and reports mean, P5, and P95. Upstream
inputs are read via upstream_value from Inv 37 (smoke
climatology), Investigation 4-3 (wildfire PM2.5 deltas), Investigation M-1
(named portfolio compositions), and Investigation 7-2 (CMIP6 climate multiplier).
Findings
| Metric | Mean | P5 | P95 |
|---|---|---|---|
| Total MWh lost / yr | 980,426 | 689,456 | 1,328,016 |
| Lost revenue ($M) | $49.0 | $34.5 | $66.4 |
| Channel A (irradiance), MWh | 253,717 (26.8%) | — | |
| Channel B (soiling), MWh | 692,732 (73%) | — | |
| % of 2019 PV generation | 2.0% | — | |
| Note: Channel A + Channel B sums to 946,449 MWh, ~34,000 MWh below the total mean (980,426). The gap is not a rounding error: the total is the MC mean of (A + B) draws, while the channel values are the MC means of A and B separately. When A and B are sampled from correlated log-normals, mean(A) + mean(B) ≠ mean(A + B) because of the covariance term. The regional decomposition (per-region means) sums correctly to 980,426. | |||
| Metric | Central | Envelope |
|---|---|---|
| Peak smoke-day PM2.5 (P95, SJV) | 110.9 µg/m³ | — |
| Peak-hour fractional GHI loss | 22.2% | 15.5%–29.9% |
| Backup capacity (MW) | 2,994 | 2,096–4,042 |
| Annualized capacity cost ($M/yr) | $180 | — |
| Portfolio | Wildfire intervention | 10-yr NPV ($M) | NPV % of cost |
|---|---|---|---|
| A_free_lunch (T1 baseline) | none | $0 | n/a |
| B_transport_2B | none | $0 | 0.00% |
| C_wildfire_instead | 5% PM2.5 reduction | $0.24 | 0.01% |
| D_all_in_4B | none | $0 | 0.00% |
| E_smart_2B | none | $0 | 0.00% |
| F_maximum_impact | 30% PM2.5 reduction | $1.47 | 0.01% |
The per-portfolio co-benefit is a legitimate accounting entry—it does not shift portfolio rankings. The best case (F_maximum_impact, 30% wildfire fuel reduction at $13.9B) recovers $1.47M in PV revenue over 10 years: 0.01% of portfolio cost.
Caveats
- Channel B soiling is screening-grade. Real soiling depends on panel tilt, surface chemistry, ash particle size, and cleaning frequency. The 2.5%-per-event central with a 21-day cleaning reset is a literature midpoint; per-site variability is substantial. The 0.5× ramp factor is a geometric approximation, not a measured accumulation profile.
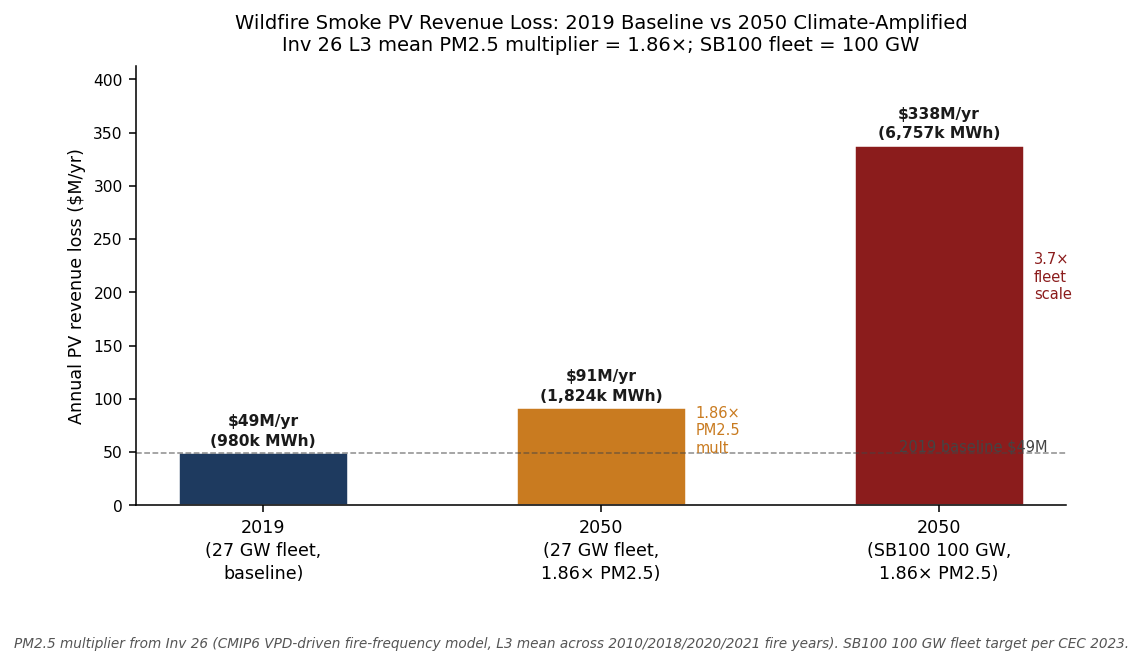
- Static 2019 PV fleet. California PV grew approximately 30% from 2019 to 2024. Fleet held constant at 27 GW for the 2019 baseline; 2050 projects separately using the 3.7× SB100 scaling. Intermediate years are not interpolated.
- Curtailment and market-design effects excluded. Smoke days often coincide with low-load conditions where solar is already curtailed—the “lost” generation may have had zero or negative marginal value. Conversely, smoke stress on evening peak demand could shift peaker requirements upward. Net direction is unclear.
- 2050 climate multiplier is uniform and central. The 1.86× PM2.5 multiplier is the mean of four Investigation 7-2 per-year L3 CMIP6 values, applied as a scalar to regional smoke days and PM2.5. Non-linear responses (more frequent extreme events vs. higher baseline smoke) are not modeled. The Investigation 7-2 CMIP6 P10–P90 fan is reported separately.
- Wholesale price is flat at $50/MWh. Smoke-day pricing can deviate significantly in either direction (stressed peaker dispatch vs. curtailed low-load). Flat rate is a screening assumption for annual revenue impact.
- PV co-benefit regional decomposition deferred. Where the wildfire intervention occurs (Sierra forest treatment vs. Klamath prescribed fire) determines which PV regions benefit most. Per-portfolio co-benefit is computed statewide-uniform.
Provenance
| File | Link | Purpose |
|---|---|---|
results.json | Full MC summary, channel decomposition, backup capacity, portfolio co-benefit, 2050 projection | |
analysis.md | Mechanical readout with diff-from-previous-run table and upstream sha256 audit | |
scenario.md | Sticky methodology, key literature anchors, upstream/downstream dependency map |
Run provenance: generated 2026-05-04T07:48:06; results.json
sha256 249bf8162352. Upstream inputs: Inv 37 (smoke
climatology, sha256 e80c6f3bce09), Investigation 4-3 (wildfire
PM2.5 deltas, sha256 115912c9a3a3), Investigation M-1
(named portfolios, sha256 145dbfd826d0), Investigation 7-2
(CMIP6 multipliers, sha256 70b1647f66c7). All upstream
inputs tracked via upstream_value with sha256 drift detection.
Key literature: Juliano et al. 2022 (Environ Res Lett 17:034010, doi:10.1088/1748-9326/ac5143 — canonical NCAR wildfire-solar paper); Gilletly et al. 2023 (Appl Energy 348:121303); Sayyah et al. 2014 (Solar Energy 107:576–604); Conceicao et al. 2018 (Solar Energy 160:94–102, Saharan dust analogue). Citations retracted from this page on 2026-05-08 after a verification audit: "Gao et al. 2021 (Atmos Environ 247:118191)" (DOI = Si et al. Beijing coal-ban study, unrelated), "Smith et al. 2020 (GRL 47:e2020GL089275)" (DOI = Rodgers et al. ocean carbon study, unrelated), and "Bilionis et al. 2020" (no matching paper found in any academic database).