California Freight Cleanup → Investigation 2-1
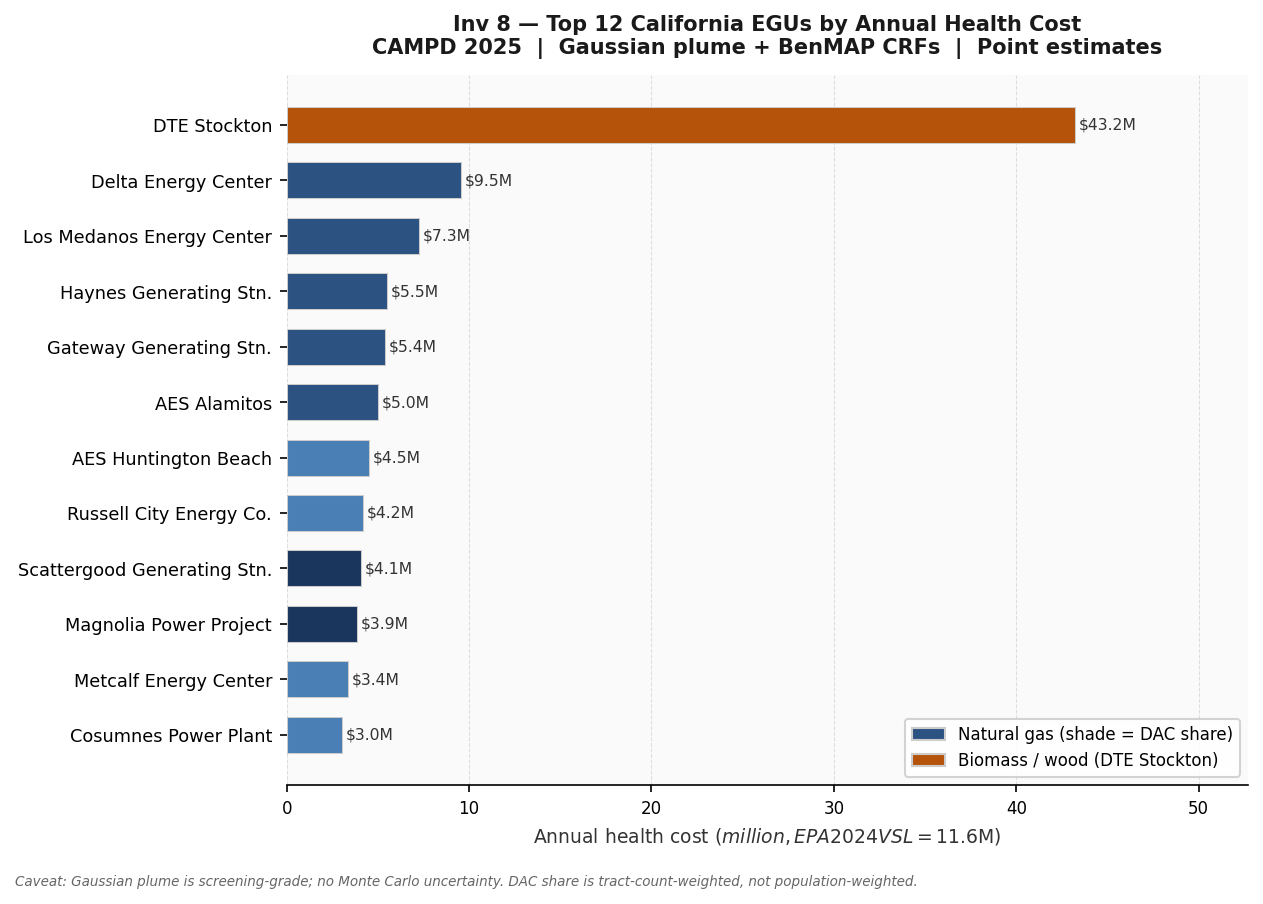
Which California power plant is the worst health offender?
68 California facilities. 11.9 deaths/yr. $138.1M annual health cost. DTE Stockton, a wood-fired biomass plant that appeared in the dataset by NOx-filter inclusion, accounts for $43.2M of that total on its own — 31% of the fleet-wide cost — at $56.71/MWh, which is 25× the gas fleet median. Among the natural gas facilities, the health cost ranking is determined by where the plant sits, not how much it emits.
The decision
CEC permit decisions for new or relicensed gas-fired generation require a health impact assessment ranking facilities by damage to surrounding populations. Two questions drove this investigation:
- Which facilities carry the highest health externality per MWh and should face the most stringent Best Available Control Technology (BACT) conditions or permit restrictions?
- Does the gas plant fleet disproportionately burden disadvantaged communities (DAC), or is its DAC exposure consistent with California’s general population distribution?
Investigation 2-1 reads no upstream the cascade's results. It feeds directly into Inv 13 (Biomass Anomaly), which computes the 20-year net benefit of closing or converting the single worst-performing facility identified here.
Methodology
Data source. CAMPD (Clean Air Markets Program Data) 2025 California reporting year: self-reported NOx and PM2.5 tons per facility with fuel type, coordinates, and unit counts. A 1.0-ton NOx minimum filters negligible peaker units; 68 facilities pass. Fuel-type filtering is not applied—so the wood-fired biomass plant DTE Stockton is included alongside the natural gas fleet.
Dispersion. Each facility’s PM2.5 and NOx
emissions are dispersed via a simplified Gaussian plume model
(GasPlantAnalyzer) onto the same 21,164-cell grid used throughout
the California Freight Cleanup portfolio. PM2.5 is the primary direct emission; NOx contributes to secondary PM2.5 and O3 formation (primarily via nitrate aerosol and NOx-O3 photochemistry) via
Health Impact Function (HIF)-calibrated surrogates within the BenMAP framework.
Health impact functions. Three BenMAP-calibrated concentration-response functions (CRFs) are applied:
- PM2.5 → all-cause mortality: Di et al. 2017 / Krewski 2009 blend (same anchor as Investigation 6-1 portfolio calibration)
- O3 → acute mortality: Roman et al. 2019
- NO2 → respiratory hospitalization: BenMAP-standard HIF
Deaths are monetized at EPA 2024 VSL mode ($11.6M); hospitalizations at cost-of-illness. The investigation runs at point estimates only—no Monte Carlo. Portfolio-level uncertainty propagation is handled in Investigation 6-1.
DAC classification. Each grid cell carries a binary DAC flag
from CES/AB 617 designation. DAC share per facility is the tract-count-weighted
fraction of affected tracts that are DAC-designated (not population-weighted).
Only facilities where DAC share exceeds 50% are flagged in the summary; the
continuous dac_share field is available for graduated analysis.
Findings
DTE Stockton: a biomass facility surfaced inside a gas-plant analysis by NOx-filter inclusion
PM2.5 emissions at DTE Stockton (1,066.8 t/yr) are 9.6× the highest gas plant in the fleet. Its $43.2M annual health cost is 31% of the entire 68-facility total, and its $56.71/MWh externality is 25× the gas fleet median (median: approximately $2.27/MWh). Any fleet-level siting guidance that pools Stockton with the gas fleet will have its aggregate statistics dominated by a single wood-fired outlier with a completely different fuel cycle. Executive reporting must present results with and without Stockton explicitly.
Location, not emission rate, determines gas plant rank
Among the 65+ natural gas facilities, the spread in NOx (23–134 tons) and PM2.5 (1.6–112 tons) does not predict health cost rank. Haynes Generating Station (LA Basin, 45.6 t NOx, $5.5M/yr) outranks Gateway Generating Station (Bay Area, 74.9 t NOx, $5.4M/yr) solely because its plume reaches a denser population at lower emission. CEC siting criteria that reward low-emission locations but ignore population density will systematically misallocate mitigation value. The $1.77–$3.23/MWh range for the top-10 gas plants is a defensible benchmark against which to set permit conditions or shadow prices.
Bay Area cluster: three co-located facilities, $22.2M/yr combined health cost
Delta Energy Center (Pittsburg, $9.5M/yr), Los Medanos Energy Center (Contra Costa, $7.3M/yr), and Gateway Generating Station ($5.4M/yr) sit within roughly 10 km of each other in the Suisun Marsh corridor. Their combined health cost ($22.2M/yr) exceeds any single-facility cost outside Stockton. Both Delta and Los Medanos exhibit meaningful O3 mortality fractions (27.6% and 33.0% respectively) because the ozone pathway is positive in this airshed — unlike the LA Basin, where additional NOx titrates ambient O3 downward. AB 617 cumulative impact methodology should apply; single-facility Gaussian plume understates the aggregate burden on the Pittsburg/Bay Point community.
LA Basin O3 disbenefit: NOx titration produces negative O3 deaths at four facilities
Haynes, AES Alamitos, AES Huntington Beach, and Scattergood all show
deaths_o3 < 0. In the NOx-saturated LA airshed, additional NOx
from these facilities suppresses ambient O3, producing a fractional
mortality disbenefit via the O3 pathway. Net total deaths remain
positive (PM2.5 dominates), but the disbenefit partially offsets
the O3 mortality component by 5–11%. This is consistent with
the California Freight Cleanup portfolio finding in Investigation 4-1 that the T2 freight electrification
ozone “co-benefit” is a co-disbenefit in 99.95% of plausible draws.
DAC burden is proportional, not targeted: fleet mean 20.2% vs. California’s 22.9%
Only Malburg Generating Station exceeds the 50% DAC threshold. Fleet-average DAC burden (20.2%) tracks California demographics (22.9% from Investigation 6-1). The gas generation fleet does not disproportionately target disadvantaged communities at current emission levels—a credible, auditable null result. DAC share is tract-count-weighted, not population-weighted; the caveat section explains the potential direction of that bias.
Top 10 Facilities by Health Cost
| Rank | Facility | Fuel | NOx (t) | Deaths/yr | Cost ($M) | $/MWh | DAC % |
|---|---|---|---|---|---|---|---|
| 1 | DTE Stockton | Wood | 111.6 | 3.725 | 43.218 | 56.71 | 35.6% |
| 2 | Delta Energy Center | Nat. Gas | 133.8 | 0.821 | 9.537 | 2.25 | 23.4% |
| 3 | Los Medanos Energy Center | Nat. Gas | 122.9 | 0.624 | 7.251 | 2.67 | 24.5% |
| 4 | Haynes Generating Station | Nat. Gas | 45.6 | 0.472 | 5.489 | 3.00 | 19.6% |
| 5 | Gateway Generating Station | Nat. Gas | 74.9 | 0.463 | 5.378 | 1.77 | 16.0% |
| 6 | AES Alamitos | Nat. Gas | 33.4 | 0.432 | 5.015 | 3.23 | 18.3% |
| 7 | AES Huntington Beach | Nat. Gas | 44.0 | 0.388 | 4.510 | 2.39 | 12.5% |
| 8 | Russell City Energy Co. | Nat. Gas | 45.9 | 0.363 | 4.211 | 2.49 | 6.2% |
| 9 | Scattergood Generating Station | Nat. Gas | 39.9 | 0.351 | 4.079 | 2.21 | 28.0% |
| 10 | Magnolia Power Project | Nat. Gas | 23.9 | 0.333 | 3.867 | 2.90 | 31.9% |
Source: CAMPD 2025. All figures are point estimates (no Monte Carlo).
VSL = $11.6M (EPA 2024 mode). Full 68-facility roster at
investigations/8_gas-plant-siting/latest/facility_results.json.
Caveats
- Gaussian plume is a screening-grade dispersion model. It does not account for terrain, building downwash, sea-breeze circulation, or photochemical transformation in complex airsheds. For ranking it is adequate; permit-level near-field assessment would need AERMOD or a mesoscale model. Facilities in topographically complex locations (Bay Area, LA coastal basin) likely have underestimated near-field concentrations.
- Fuel-type filtering is not applied. DTE Stockton (wood-fired biomass, PM2.5 = 1,066.8 t/yr) is included because the CAMPD query filters on NOx ≥ 1 t/yr, not fuel type. Always report results with and without Stockton separately.
- DAC share is tract-count-weighted, not population-weighted. A facility whose plume covers three small rural DAC tracts and one large urban non-DAC tract reports 75% DAC share even if 90% of affected people are non-DAC. Population-weighted equity burden would change the DAC ranking materially for Bay Area and rural facilities.
- No Monte Carlo; all per-facility numbers are point estimates. The ranking carries no uncertainty interval. Facilities within ~10% of each other in health cost (Ranks 3–7 span $5.0–$7.3M) could plausibly reorder under CRF or emission uncertainty.
- Dispersion coefficients are not re-anchored to monitor observations. Unlike the AQS-anchored ISRM rescale used elsewhere in the California Freight Cleanup portfolio, per-facility absolute health-cost numbers carry an unquantified bias from this gap.
- Baseline mortality rates are 2013 vintage. Counties with anomalous post-2013 mortality trends are over- or under-ranked accordingly—a shared limitation across the California Freight Cleanup portfolio (Investigation 6-1).
-
health_cost_per_mwhrequires CAMPD generation data, which may be zero or missing for peakers and backup units. Do not rank by this field without filtering for facilities with valid MWh generation.
Provenance
| Artifact | Description |
|---|---|
run.py | CAMPD ingest, Gaussian plume, HIF application, results write |
results.json | Fleet totals, top-10, run parameters (sha256 2c2988fbee49) |
facility_results.json | Full per-facility ranking, all 68 facilities |
dac_analysis.json | Top-20 by DAC share (min 10 t NOx) |
facility_results.csv | CSV flat file; consumed by Inv 13 (Biomass Anomaly) |
analysis.md | Full observations, findings, confidence, recommendations |
scenario.md | Why the investigation exists; methodology; key anchors; caveats |
run_info.json | Forensic provenance: timestamp, script sha256, git rev, wall time |
Run date: 2026-05-01. CAMPD year: 2025. VSL: $11.6M (EPA 2024 mode). Min NOx threshold: 1.0 tons. Facilities analyzed: 68. Analysis wall time: 0.2 s.