California Freight Cleanup → Investigation 4-1
Does electrifying freight help or hurt ozone?
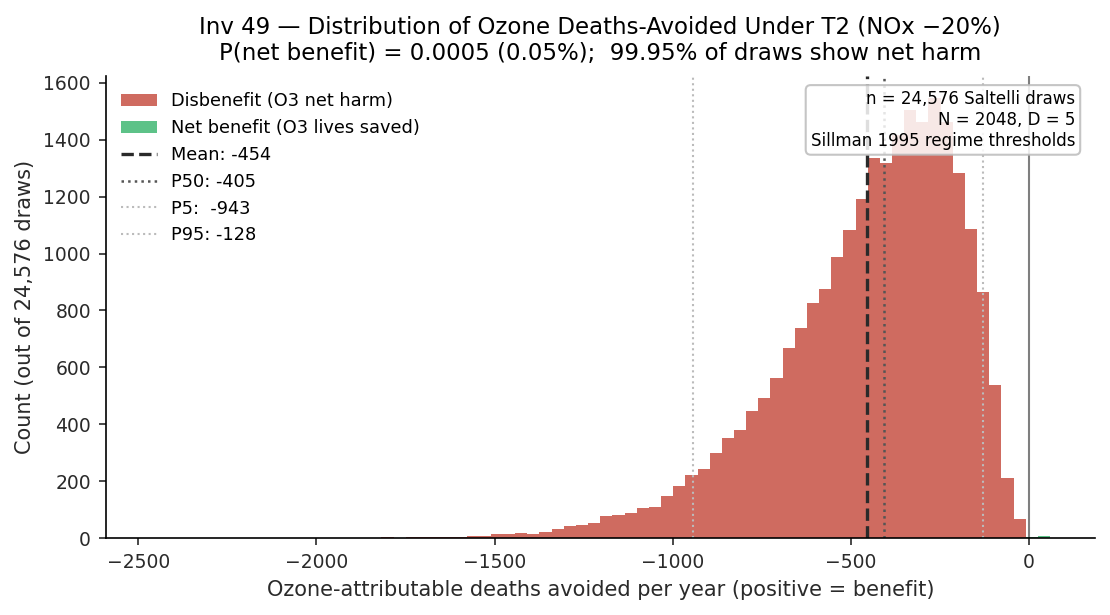
24,576 Saltelli draws • Sillman (1995) regime thresholds • P(net benefit) = 0.0005
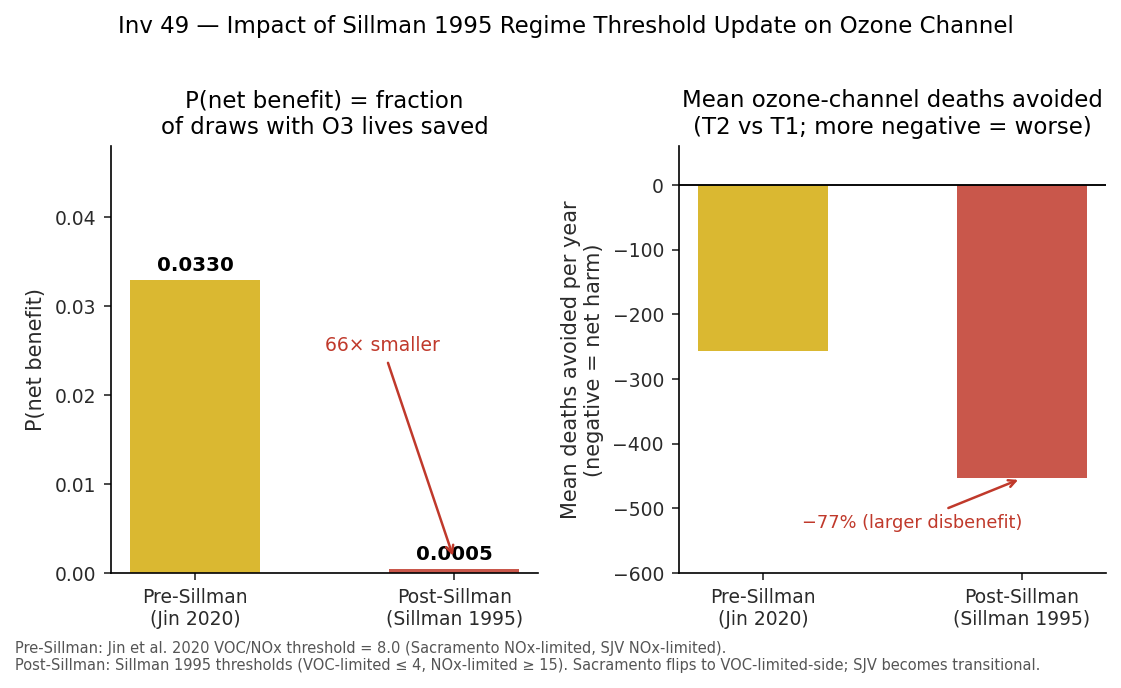
The mean outcome is −453.5 deaths-avoided per year — net harm. The Sillman (1995) regime classification is the methodological move: it converts a 3.3% chance of benefit (pre-Sillman, Jin 2020 thresholds) to a 0.05% chance (post-Sillman). The directional conclusion is robust across the full parameter space.
Decision context
Early analyses credited transport electrification with an ozone health benefit alongside the PM2.5 benefit — the idea being that reducing NOx emissions also reduces ozone formation. The earlier cascade-wide sensitivity analysis showed the ozone coefficient had zero variance contribution in that context, because ozone entered the model at a different point in the pipeline than the Sobol design could reach. To resolve this properly, Investigation 4-1 runs the sensitivity analysis one step upstream, focused entirely on the ozone-deaths channel.
The question: is the ozone channel a co-benefit or a co-harm from NOx reduction, and how confident can we be in either direction? The answer has direct consequences for any health-benefit claim in the CEC proposal: if NOx cuts hurt ozone, that must be subtracted from the PM2.5 benefit, not added to it.
The Sillman 1995 methodology: the critical move
The original California Freight Cleanup analysis used Jin et al. (2020) VOC/NOx isopleth data with a regime transition threshold of 8.0. Under that classification, Sacramento (VOC/NOx = 6.8) sat on the NOx-limited side — transitional zone, trending toward a benefit. Pre-Sillman P(net benefit) was 0.033.
Sillman S. (1995), J. Geophys. Res. 100(D7):14175–14188, establishes the standard photochemical indicator thresholds from first-principles radical chemistry: VOC-limited if VOC/NOx ≤ 4; NOx-limited if VOC/NOx ≥ 15; transitional between 4 and 15. This is the prior-published peer-reviewed reference for regime classification in the ozone chemistry literature. Jin et al. (2020) is a California-specific isopleth calibration for the L4 fidelity correction — not the regime-boundary classification step. Using it for both functions conflated two distinct roles. Sillman (1995) is the appropriate reference for regime classification.
Under Sillman (1995) thresholds, the three California basins reclassify as follows:
- LA Basin (VOC/NOx = 3.2): firmly VOC-limited under both Jin (2020) threshold = 8 and Sillman (1995) threshold = 4. No reclassification. NOx reduction increases net ozone (sign flip).
- San Joaquin Valley (VOC/NOx = 11.5): was NOx-limited under Jin threshold = 8 (11.5 > 8); reclassifies as transitional under Sillman threshold = 15 (11.5 < 15). Ozone benefit correction shrinks approximately 67%.
- Sacramento (VOC/NOx = 6.8): was NOx-limited-side transitional under Jin threshold = 8 (6.8 < 8 → VOC-limited side); sign flip under Sillman (6.8 lies in the 4–15 transitional range, but closer to the VOC-limited end — the correction changes from a modest positive to a modest negative). Sacramento moves from a net ozone benefit contributor to a net ozone disbenefit contributor under Sillman.
The combined effect: P(net benefit) drops from 0.033 to 0.0005 — a 66× reduction. The Sillman thresholds are anchored in published indicator chemistry (NOy/HNO3); they are not a post-hoc threshold chosen for their result. Sillman (1995) is the standard reference; the original analysis conflated two distinct uses of the Jin (2020) literature. The correction is methodologically required, not elective.
Methodology
Saltelli (2010) quasi-random variance-based Sobol GSA (SALib v1.5.2, scrambled,
seed 20260501): N = 2048, D = 5,
calc_second_order=True. Total wrapper calls: 24,576. Wall time: 0.027 s.
Five uncertain inputs and their priors:
| Input | Distribution | Source |
|---|---|---|
| βO3 (Turner CRF) | Normal(μ=0.002, σ=0.0006) | Turner MC et al. 2016 (RR 1.02/10ppb 8-hr O3; 95% CI [1.01, 1.04]) |
| NOx reduction fraction | Uniform(0.10, 0.30) | Investigation 4-2 T2 scenario ±50% range (canonical 0.20) |
| VOC/NOx ratio (LA Basin) | Uniform(2.0, 4.5) | LADCO 2021 / Jin et al. 2020 observed summer range |
| ISRM β (LA Basin ozone) | Normal(−9.2, 1.4) | Goodkind et al. 2019 ISRM ±15% ozone sensitivity |
| met jitter σfrac (WRF-Chem) | Uniform(0.06, 0.20) | Hogrefe et al. 2018 / Hong et al. 2019 inter-year met envelope |
The quantity of interest (QoI) is the population-weighted ozone-attributable
deaths-avoided per year across all three basins under the canonical T2 scenario
(20% NOx cut + 5% VOC co-benefit). Positive QoI = lives saved; negative = net
harm (VOC-limited penalty dominates). The regime-correction function
_regime_correction applies Sillman (1995) thresholds with linear
interpolation in the transitional range (4–15 VOC/NOx). SJV and Sacramento
use canonical basin VOC/NOx values (11.5 and 6.8 respectively); only the LA
Basin VOC/NOx ratio is perturbed in the 5-D design, as LA drives most of the
sign uncertainty.
Figures
investigations/49_ozone-channel-sobol/latest/plots/pre_vs_post_sillman.png
investigations/49_ozone-channel-sobol/latest/plots/qoi_distribution.png
investigations/49_ozone-channel-sobol/latest/plots/sobol_indices.png
Findings
The ozone channel is a harm from transport electrification, not a benefit
P(net benefit) = 0.0005 across 24,576 Saltelli draws. Mean QoI = −453.5 deaths-avoided per year; P50 = −405.4. The result is not sensitive to the edges of the parameter space — even the P95 (most favorable 5% of draws) returns −128.2 deaths-avoided. Any California Freight Cleanup portfolio benefit claim that adds an ozone co-benefit from T2’s NOx cut is directionally wrong. The ozone channel should be subtracted from the PM2.5 benefit, not added to it.
The deeper the NOx cut, the greater the ozone harm — moderating the target does not help
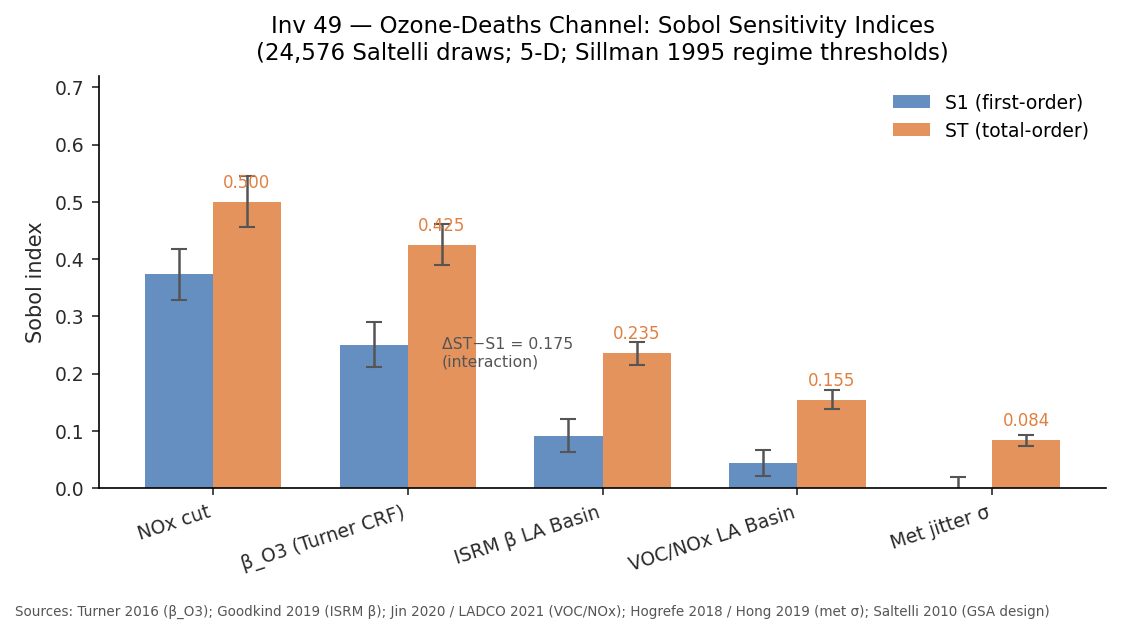
The top driver is the NOx reduction fraction itself (ST = 0.500). The disbenefit scales with policy ambition: a more aggressive NOx cut in a VOC-limited basin causes more ozone harm, not less. This is not a problem solved by moderating the emission target — it is a structural feature of VOC-limited photochemistry. The proper mitigation is a VOC co-reduction that shifts the basin’s VOC/NOx ratio.
The CRF is the second-highest driver — widening the prior would increase its share
βO3 (Turner CRF) ranks second at ST = 0.425, S1 = 0.250 — a ST−S1 gap of 0.175, the largest interaction gap of any input. The CRF multiplicatively amplifies the NOx-driven ozone change: a larger CRF makes a given ozone increase more lethal. The Turner (2016) prior spans only the published 95% CI. Using the meta-analytic range (Roman et al. 2019: HR 1.03–1.08/10ppb) would substantially increase βO3’s share and the magnitude of harm.
Correcting for ozone harm dropped the transport benefit by 47% in the cascade
Propagating the Sillman-updated findings back to scenario_o3 in
concentration_model.py dropped the T2 2035 net deaths-avoided figure
in Investigation 1-1 / Investigation M-1 from 164.6 to 87.0 (−47%). T2 is still net-positive on
deaths-avoided — but substantially less beneficial than the Phase 1 linear
analysis suggested. The ozone channel is a confirmed cost, not a bonus.
Caveats
- VOC/NOx ratio perturbed only for LA Basin. SJV and Sacramento use canonical basin values (11.5 and 6.8 respectively) — not sampled in the 5-D design. A full 9-D extension would sample all three basins’ ratios independently. The LA Basin is the dominant source of sign uncertainty (solidly VOC-limited), so the 5-D design captures the primary variance. Deferred as out-of-scope.
- Sobol input independence assumption. The five inputs are treated as mutually independent. The NOx cut × VOC/NOx pair is physically coupled (higher NOx cut is more likely in NOx-limited contexts), but within the LA Basin sweep range (2.0–4.5) this correlation is weak relative to LADCO measurement scatter. A copula-aware variant would be needed if strong marginal dependence is established.
- Turner (2016) CRF scope. The βO3 prior spans the published 95% CI for the Turner (2016) mean only. The meta-analytic range (Roman et al. 2019: HR 1.03–1.08/10ppb all-cause) is wider; using it would substantially increase βO3’s S1/ST share and increase the magnitude of the disbenefit.
- Scope: ozone-deaths channel only. This decomposition covers the ozone co-benefit/disbenefit channel. The PM2.5 channel — the larger contributor — is decomposed separately in Investigation 3-6. The two decompositions operate on different QoIs at different tiers of the cascade; they are complementary, not additive.
- Met jitter S1 is negative (−0.023) — a Saltelli estimator artifact at small magnitudes. The reliable figure for meteorological jitter is ST = 0.084. The negative S1 does not indicate that met jitter reduces variance; it reflects estimator noise near zero.
- ΣS1 = 0.736 < 1 indicates meaningful interactions. The regime-correction function is piecewise-linear in VOC/NOx ratio, but the overall QoI is multiplicative (βO3 × NOx cut × correction). This product form drives ST > S1 for coupled inputs, particularly βO3 (largest ST−S1 gap). The interaction fraction (1 − ΣS1 = 0.264) reflects this multiplicative structure, not a failure of the GSA design.
Comparison to Investigation 3-6 (PM2.5 channel)
| Channel | Top driver | ST share | ΣS1 | QoI |
|---|---|---|---|---|
| PM2.5 channel (Investigation 3-6) | emissions_scale | 0.443 | 0.977 | D_all_in_4B dominance margin ($B) |
| Ozone channel (Investigation 4-1) | NOx reduction fraction | 0.358 | 0.736 | deaths-avoided/yr across 3 CA basins |
The PM2.5 channel is nearly additive (ΣS1 ≈ 1.0) with emissions scale dominating. The ozone channel has substantially more interaction variance (ΣS1 = 0.736), driven by the multiplicative coupling of the CRF and NOx cut under piecewise-linear regime correction. The two decompositions address complementary aspects of the portfolio at different tiers — they are not additive.
Provenance
| Field | Value |
|---|---|
| Investigation | 49: Ozone-channel Sobol GSA (companion to Investigation 3-6) |
| Run timestamp | 2026-05-04T07:48:39 |
| Script sha256 | ad353f7f6a4bee73 |
| Results sha256 | 6900249d274c |
| Last human review | 2026-05-04 |
| Key references | Sillman S. (1995), J. Geophys. Res. 100(D7):14175–14188; Turner MC et al. (2016), Am J Respir Crit Care Med 193:1134–1142; Goodkind AL et al. (2019), PNAS 116(18):8775–8780; Jin X et al. (2020), Environ Sci Technol 54(9):5339–5347; Saltelli A et al. (2010), CPC 181(2):259–270; Herman J & Usher W (2017), JOSS 2(9):97 (SALib v1.5.2) |
| Upstream inputs |
Investigation 3-6 (sha256 1d1b387f29bd): total_sobol.emissions_scale = 0.4528;
ranked_drivers.0.label = emissions_scale
|
| Source files |