California Freight Cleanup → Investigation M-3
Can a portfolio beat the hand-crafted option on health, equity, and cost all at once?
100-point frontier • 4/6 seeds envelope-robustly dominated • max deaths: 970 at $8.9BThe portfolio robustness analysis (Investigation 23) evaluated six hand-crafted options by collapsing health, equity, and cost into a single dollar number — which forces a hidden exchange rate between outcomes nobody has agreed on. This investigation refuses that collapse. We ran an evolutionary search across a continuous design space and computed the full Pareto frontier: the set of allocations where you genuinely can’t improve on all three dimensions at once, without picking winners and losers up front.
The decision
Scalarizing health, equity, and cost into a single monetized number forces an implicit exchange rate between DAC and non-DAC deaths—one that is never stated, and that CEC reviewers are unlikely to endorse as a hidden assumption. Investigation M-3 does not make that choice. The output is a Pareto frontier: the set of allocations from which no reallocation simultaneously improves all three objectives. The frontier shows policymakers the actual tradeoff without a model-chosen weighting.
Two questions drive the investigation: what allocation structure cannot be improved on all three dimensions simultaneously, and how many of the six Investigation 6-4 hand-crafted portfolios survive a continuous search?
Methodology
Surrogate objective model. A deterministic linear function of five design variables: wildfire reduction fraction, transport spend ($B), building spend ($B), indoor AQ spend ($B), and DTE retire flag. Deaths-per-dollar coefficients are calibrated live each run from upstream investigations:
| Coefficient | Value | Source |
|---|---|---|
| transport_deaths_per_B | 39.97 | Investigation 1-1 (baseline−T2) / $2B |
| building_deaths_per_B | 41.22 | Investigation 1-2 (baseline−B2) / $2B |
| wildfire_deaths_per_unit | 218.0 | Investigation 4-3 5% Di+Krewski midpoint / 0.05 |
| indoor_deaths_per_B | 320.25 | Inv 19 indoor Di+Krewski midpoint / $2B |
| DTE_deaths | 3.10 | CARB Stockton TIRCP (fixed) |
Three objectives minimized simultaneously by NSGA-II (Deb et al. 2002, IEEE TEC, population 100, 80 generations, SBX crossover eta = 15, polynomial mutation eta = 20, seed 42):
- f1 = −deaths avoided (maximize aggregate health)
- f2 = −DAC-weighted deaths avoided (maximize equity benefit)
- f3 = cost ($B) (minimize spend)
GP residual correction (Phase 2d). A Gaussian Process is fit on
residuals between Investigation M-1 P50 deaths and the linear surrogate at 5 named-portfolio
anchors (Matern ν = 1.5, ARD, log-marginal-likelihood −20.61).
A second NSGA-II run optimizes against the GP-corrected objective; its frontier
reports separately as gp_pareto.
Envelope-robust dominance (Phase 5c.7). For each Investigation 6-4 seed, 1,000 Monte Carlo draws sample residuals from the GP’s predictive Normal(μ,σ). A seed is “envelope-robustly dominated” iff some frontier point dominates it in ≥95% of draws.
Findings
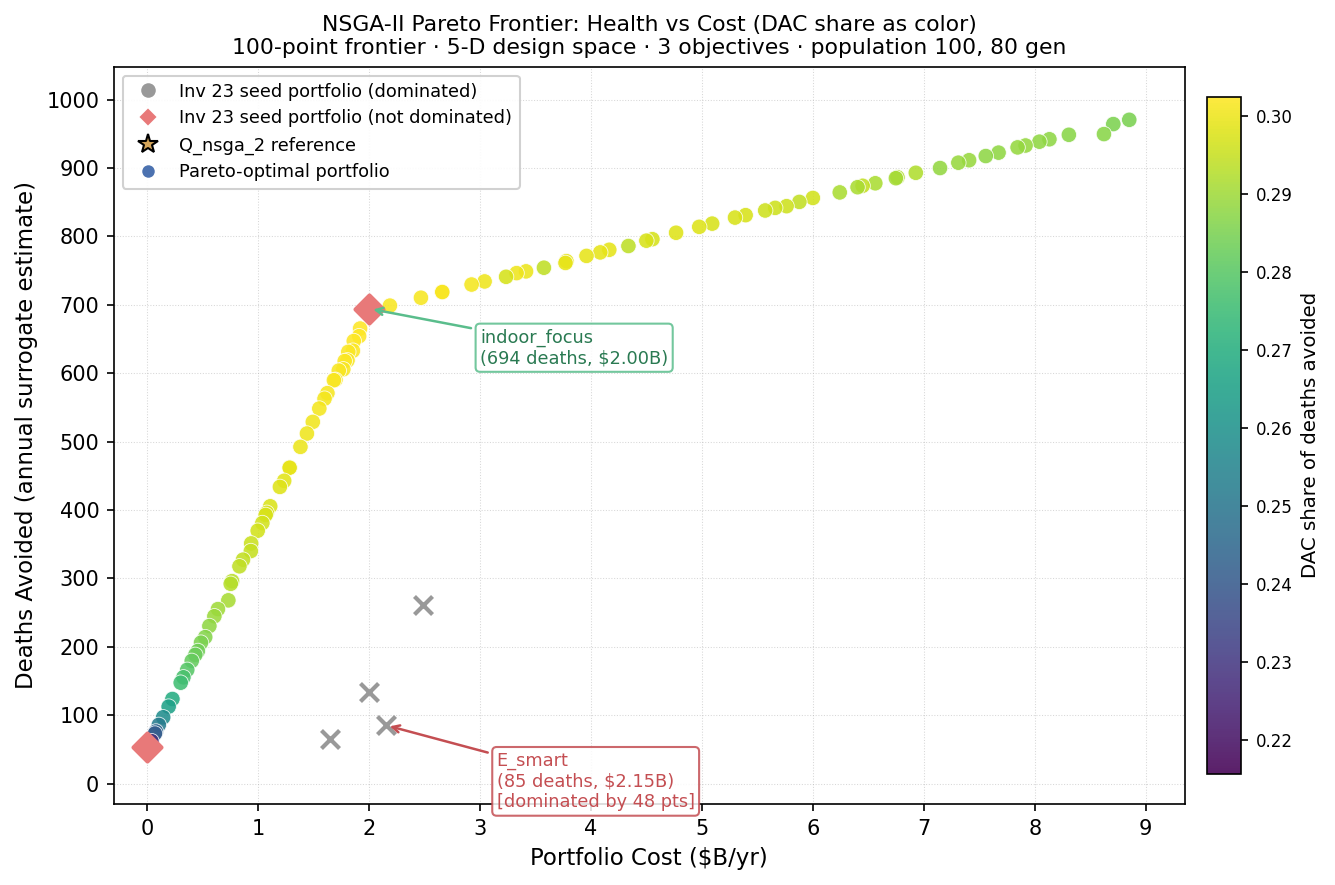
48 frontier allocations beat the “smart” portfolio on health, equity, and cost at the same time
The deterministic linear frontier produces 48 of 100 Pareto points that simultaneously beat E_smart_2B on deaths avoided, DAC-weighted deaths, and cost. The best dominator gains 580 additional deaths avoided while spending $230M less. Under the GP-corrected frontier, 5 of 100 points dominate E_smart; 5 of 6 seeds are GP-mean-dominated.
4 of 6 original portfolios are beaten in over 95% of 1,000 uncertainty draws — robust to model error
B_transport_2B, C_wildfire, E_smart, and balanced_2B are all envelope-robustly dominated (P = 1.00 in 1,000 GP-residual MC draws). A_free_lunch is on or near the frontier (P = 0.52) because its $0 cost makes it hard to dominate on all three dimensions. The indoor_focus seed is also on or near the frontier (P = 0.78) because its indoor-AQ-heavy design is closest to the NSGA-discovered high-equity region.
Indoor air quality is the high-efficiency, high-equity lever the hand-crafted menu underweighted
The max-DAC-share corner of the frontier ($1.92B cost, DAC share 0.302) is driven by indoor AQ investment—a lever the Investigation 6-4 hand-crafted menu never fully explored. Indoor AQ deaths-per-dollar (320.25/B) is 8× higher than transport (39.97) or building (41.22), primarily through its high DAC share. A CEC proposal emphasizing disadvantaged community benefit should lead with this corner.
The max-benefit corner of the continuous design space
The max-deaths corner of the 100-point frontier achieves 970 deaths avoided at $8.9B—roughly 5.8× the 166 deaths of D_all_in_4B at $4B, driven by the indoor AQ and wildfire levers filling the continuous design space above the Investigation M-1 discrete menu’s ceiling.
NSGA-II vs Investigation 6-4: what the two investigations answer
Investigation M-3 and Investigation 6-4 answer different questions. Investigation M-3 optimizes a 3-objective vector (deaths, DAC-deaths, cost) with no VSL conversion and no Monte Carlo uncertainty. Investigation 6-4 optimizes a scalar net-benefit (deaths × VSL − cost) with full CRF-posterior MC and CVaR robustness. A frontier point that dominates E_smart here may not dominate it under Investigation 6-4’s MC net-benefit distribution or CVaR criterion. This is not a contradiction—it is a difference in what “dominates” means.
Caveats
- Deterministic surrogate, not MC. Frontier is computed against point-estimate deaths-per-$B with no uncertainty propagation. The same design vector dominating E_smart here may not dominate under Investigation 6-4’s MC net-benefit distribution.
- Linear spend model. Constant marginal returns are assumed. Real programs exhibit diminishing returns at scale, overstating high-spend allocations.
- Indoor AQ coefficient calibrated live but still carries uncertainty. The current 320.25 deaths/$B (from Inv 19 Di+Krewski midpoint) is a significant improvement over the prior hardcoded 150 deaths/$B, but Inv 19 shows sha256 drift. Re-verify before publishing indoor AQ allocations.
- NSGA-II result is stochastic. The 100-point frontier is one draw with seed 42. The 48-dominator count is stable across this run but has not been convergence-tested against larger populations or generation budgets.
- GP correction is small-N (5 anchors). Predictions at design points far from the anchors revert to the linear surrogate plus inflated residual uncertainty. GP-corrected frontier results are informational, not primary.
Provenance
| Item | SHA-256 (12-char) | |
|---|---|---|
| results.json | 0f8801139ccb |
|
| analysis.md | — | |
| scenario.md | — | |
| Upstream: Investigation 6-4 (portfolio robust) | investigations/23_portfolio-robust/latest/results.json | cab2edc05333 |
| Upstream: Inv 19 (indoor AQ) | investigations/19_indoor-air/latest/results.json | 9496484b2d20 |
| Key reference | Deb et al. (2002), IEEE TEC—NSGA-II algorithm. pymoo library implementation. | |
| Run timestamp | 2026-05-04T07:48:02 pop=100 gen=80 seed=42 runtime ~34s | |