California Freight Cleanup → Investigation M-2
How much does adaptive re-planning beat a one-shot commitment?
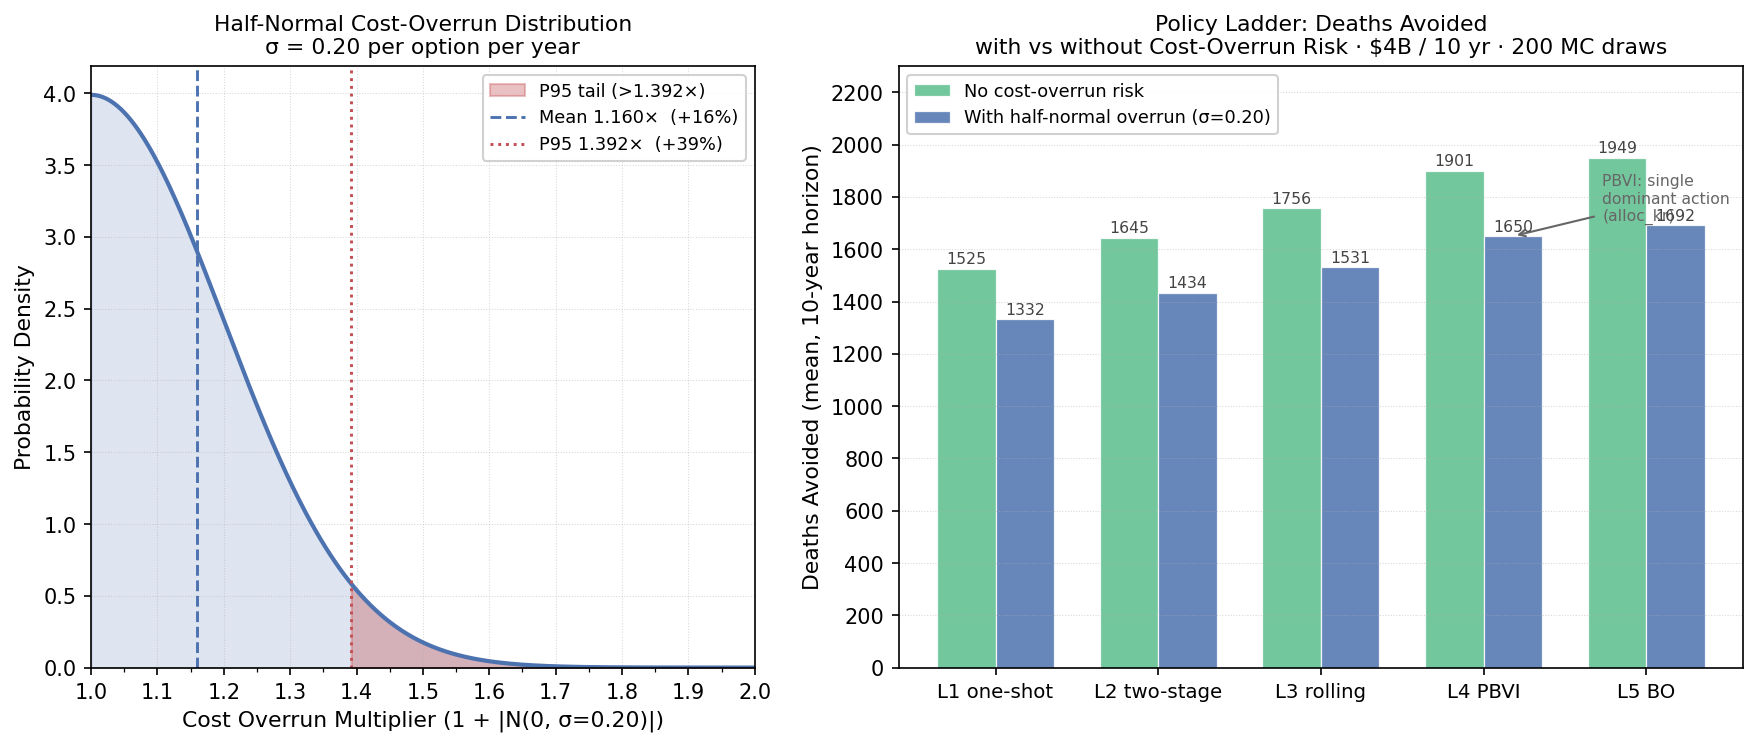
The formal belief-conditioning step (PBVI) collapsed to a single dominant action at every belief state. The +23.9% lift at that level reflects best-allocation under value iteration, not true adaptive policy. We say so in the writeup.
Best sequential policy: 1,692 deaths avoided over 10 yr vs 1,332 for a static one-shot planFive policy classes, from a static pre-committed plan to a Bayesian-optimization-tuned adaptive policy, evaluated over 200 simulated 10-year trajectories on a $4 billion horizon. A cost-overrun model (mean 1.16×, 95th percentile 1.39×) is embedded throughout. The ranking of policies is unchanged under cost risk.
The decision
Phase 1 assumed a static, pre-committed allocation schedule. That assumption ignores the most important feature of a real program: every year, monitoring data and health surveillance update what we know about which dose-response regime is operating. A program that ignores that signal leaves preventable deaths on the table.
The dose-response function is the dominant uncertainty in the California Freight Cleanup portfolio. This investigation quantifies how much an adaptive strategy is worth — across five escalating policy classes, measured in deaths avoided per dollar over a 10-year horizon.
Methodology
Simulation envelope. 200 Monte Carlo trajectories per policy, 10-year horizon, $400M annual budget ($4B total), 3% CEC programmatic discount rate. Each trajectory draws a “true CRF” β from a three-component mixture: 35.0% Di et al. 2017 (β = 0.00705), 35.0% Krewski et al. 2009 (β = 0.00545), 30.0% Investigation 6-3 hierarchical posterior (β = 0.02439). The true CRF is fixed within a trajectory but unknown to the policy. The Investigation 6-3 hierarchical posterior β = 0.02439 is ~3.5× either Di (0.00705) or Krewski (0.00545); trajectories drawn from the 30%-weighted Investigation 6-3 arm therefore dominate mean deaths-avoided. This mixture is a stress-test design, not a policy prior.
Five policy levels.
- L1 — One-shot static. Allocation pre-committed at program start; no learning. The Phase 1 reference.
- L2 — Two-stage stochastic. Commits to a 5-year plan, observes year-5 mortality data, replans the remaining 5 years. One observation break.
- L3 — Rolling-horizon. Re-solves a 10-year horizon each year given the current CRF point estimate. Annual replanning; no belief-state tracking.
- L4 — PBVI POMDP. Full point-based value iteration (Pineau, Gordon & Thrun 2003) over a stationary 3-state POMDP. State space: three CRF regimes {Di, Krewski, Investigation 6-3 posterior}. Action space: four candidate allocations (alloc_di, alloc_kr, alloc_inv21, alloc_balanced). Observation model built empirically by Monte Carlo replay (N=2,000). Alpha-vector backups iterate to convergence.
- L5 — Multi-fidelity Bayesian optimization. A 2-parameter BO search using the Kennedy-O’Hagan AR1 multi-fidelity kernel (L1–L4 as low-fidelity surrogates) tunes learning rate and exploration fraction. The KO AR1 fusion also produces a cross-policy posterior mean (1,652.8 deaths) and sigma (298.5).
Cost-overrun model (Phase 2b). A half-normal distribution (overrun = 1 + |N(0,σ)|, σ = 0.20) models program execution risk. Mean overrun factor: 1.16×; P95: 1.39×. Every policy level is tested with and without cost-overrun risk.
Policy results
| Policy | Deaths avoided (mean) | Deaths/$B | vs L1 | Cost-overrun Δ deaths |
|---|---|---|---|---|
| L1 one-shot | 1,332 | 333 | baseline | −193 (−12.6%) |
| L2 two-stage | 1,434 | 359 | +7.7% | −211 (−12.8%) |
| L3 rolling | 1,531 | 383 | +14.9% | −225 (−12.8%) |
| L4 PBVI POMDP | 1,650 | 413 | +23.9% | −251 (−13.2%) |
| L5 BO-tuned | 1,692 | 423 | +27.1% | −257 (−13.2%) |
Findings
alloc_kr) at every
belief state — the +23.9% lift over L1 reflects best-static-allocation under value
iteration, not adaptive belief tracking.
Sequential adaptivity is worth +360 deaths over 10 years (+27.1%)
The gap between L1 (one-shot) and L5 (best sequential) is 360 deaths avoided over the 10-year horizon, or +90.1 deaths/$B. This is the value of building a program that re-optimizes as CRF evidence accumulates, rather than committing to a pre-specified allocation schedule.
PBVI collapses to a single dominant action: the gain is optimization, not adaptivity
The PBVI solver returns alpha_vector_count = 1 and unique_actions_selected = 1. At every probed belief—prior-mix, uniform, all three corner-confident beliefs, all three two-state splits—PBVI picks alloc_kr regardless. The +23.9% L4 lift over L1 is best-static-allocation under value iteration, not genuine belief-conditioned adaptivity. Under this 4-action menu, the optimal allocation is regime-invariant—the operational value of true adaptivity is approximately zero. Sequencing still pays via L2/L3 myopic re-optimization; PBVI contributes global optimization, not optionality.
Best policy unchanged under cost-overrun: cost risk does not flip the ranking
All five policy levels suffer a proportional −12.6% to −13.2% deaths reduction from the half-normal cost-overrun tail (mean 1.16×, P95 1.39×). The ranking L5 > L4 > L3 > L2 > L1 is unchanged. Program-execution cost risk does not reverse the recommendation to choose adaptive over static policies.
KO AR1 multi-fidelity fusion: cross-policy posterior mean 1,653 deaths, σ 299
The Kennedy–O’Hagan AR1 fusion across policy levels (using L1–L4 as low-fidelity proxies and L5 as the high-fidelity anchor) produces AR1 correlation ratios ρ = 1.076, 1.098, 1.039 across consecutive levels. The posterior mean (1,653 deaths) and sigma (299) characterize overall simulation uncertainty across the policy fidelity ladder.
Caveats
- PBVI action collapse is confirmed and pinned by a test.
tests/test_inv22_pbvi_integration.py::test_l4_pbvi_picks_dominant_actionasserts this property. Any future menu expansion that breaks the monotone dominance of T2-share would change the POMDP behavior qualitatively. - Belief state is CRF-only. Deployment feasibility, contractor availability, permitting delays, and ISO interconnection backlogs are all treated as known and non-stochastic. In a real program these operational uncertainties likely dwarf the CRF uncertainty in year-to-year variability.
- 200 trajectories adequate for mean ranking, not tail estimation. P5/P95 confidence intervals are wide at 200 draws. The L4–L5 gap (42 deaths) is modest relative to within-policy SD (525–541 deaths).
- Investigation 6-3 β is read live, not hardcoded.
As of Phase 6 (2026-04-30), the MC pipeline injects the live Investigation 6-3
posterior β via
upstream_valuebefore each run. Thestale_hardcoded_beta = 0.00649in results.json is retained as a historical provenance label only — it is not used in the policy comparison above. The 1.79e−02 drift figure reflects the distance between that historical constant and the current live value; the policy table is valid. - L5 BO is 2-parameter. The optimization tunes learning rate and exploration fraction only. A higher-dimensional policy space (region-specific budgets, technology-category splits) would require Emukit multi-fidelity kernels.
Provenance
| Item | SHA-256 (12-char) | |
|---|---|---|
| results.json | 856374cbd57f |
|
| analysis.md | — | |
| scenario.md | — | |
| Upstream: Investigation 6-3 (CRF posterior) | investigations/21_crf-hierarchical-bayes/latest/results.json | 3104ba850408 |
| Key reference | Pineau, Gordon & Thrun (2003) — PBVI point-based value iteration. Kaelbling et al. (1998) — canonical POMDP formulation. Kennedy & O’Hagan (2000) — KO AR1 MF-GP. | |
| Run timestamp | 2026-05-04T07:46:20 N_traj = 200 per policy horizon = 10yr budget = $4B seed = 2026 | |