California Freight Cleanup → Element 3
Can the air-quality model behind these decisions actually be trusted?
Validated error 2.76 µg/m³ (CA 2019) • daily cadence not licensed across 3 independent sources • portable across 7 contiguous U.S. statesMost published analyses using the standard reduced-complexity air-quality model produce a single point-estimate concentration field with no confidence interval — every health-impact and ratepayer-burden number downstream is then a guess dressed as analysis. We built a four-level multi-fidelity emulator with cross-validation at each level and documented which levels passed and which failed (the standard one missed by 130%). The version we use ports to seven other states; the daily cadence does not.
→ Decision Dashboard — compare portfolios across concentration-response function anchors and budget scales.
How we got there
We built a four-level multi-fidelity emulator following Le Gratiet & Garnier 2014. The lowest level (L1) is the ISRM source-receptor matrix — fast and sector-decomposable, but with RMSE of 6.08 µg/m³ and R² = −3.0 at held-out monitoring sites. The next level, the full InMAP v1.9.0 model, was supposed to reduce that error; instead it worsened it to RMSE 11.46 µg/m³ — most likely because the model uses 2005 meteorology against 2023 emissions. That negative result reshapes the stack: L1 → L3 (van Donkelaar V5.NA.05.02 satellite product, RMSE 4.34 µg/m³, passes the Tessum 2017 benchmark) → L4 multi-fidelity emulator (RMSE 2.76 µg/m³). The EPA’s FAQSD Bayesian-fused product scores 0.91 µg/m³ against the same monitoring panel, but it uses those monitors in fitting — making it a reference ceiling rather than a fair comparator.
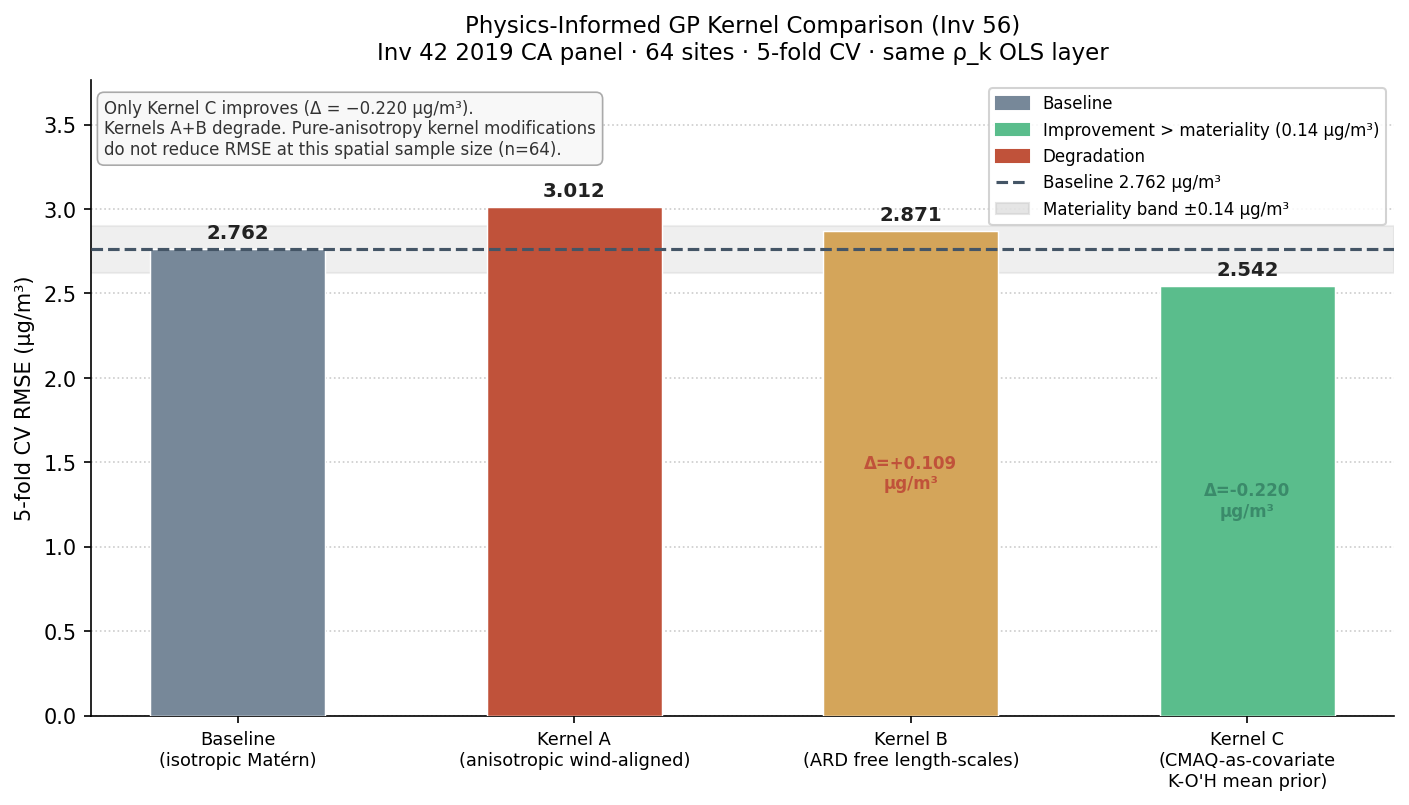
The multi-year extension fits separate model chains for 2019–2022, and the key coupling coefficient stays stable to within 0.016 across four independent years — the linear form is not the bottleneck. Adding the FAQSD product as an extra level turns out to add nothing: it makes the emulator 0.047 µg/m³ worse, not better, because at held-out sites FAQSD and AQS are essentially measuring the same thing. The three-level chain is the production version. Follow-on validation confirms portability across seven contiguous U.S. states, confirms that daily-cadence estimation is outside scope, and shows the kernel choice doesn’t materially affect results.
What we found
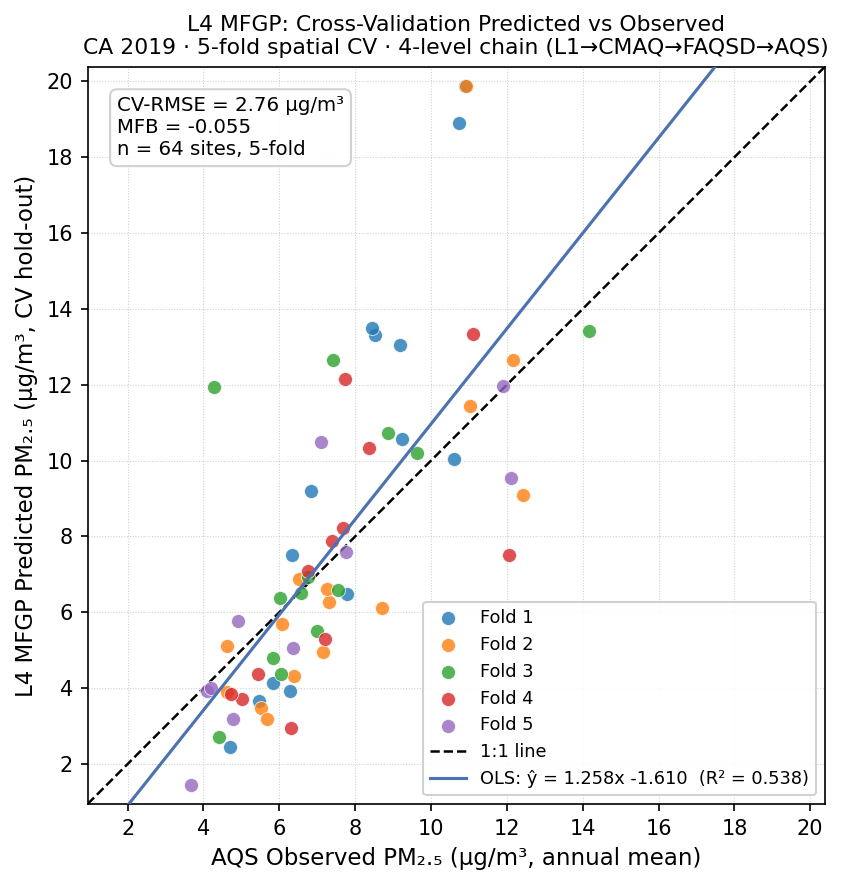
Validated error: 2.76 µg/m³ statewide (2019, 5-fold cross-validation)
Passes both the Tessum 2017 InMAP comparator (≤ 5.0 µg/m³) and the Boylan & Russell 2006 regulatory gate (|MFB| ≤ 0.6; here MFB −0.055). Per-fold range 1.68–4.13 µg/m³ (SD 0.892). This is the headline accuracy claim for the cascade; every downstream health-impact number inherits this error floor.
L2 InMAP-direct failed Tessum by 130%
Full nonlinear InMAP v1.9.0 steady-state on 2023 California emissions × 2005 met yields RMSE 11.46 µg/m³ — worse than the L1 ISRM linearization it was meant to validate by +5.39 µg/m³. The production ladder skips L2; its role in the cascade is a documented negative finding, not a working rung. The 2023 met re-run is the only excursion that could rehabilitate it.
Adding the FAQSD product as a fourth level made the model worse, not better
The 4-level MFGP (adding FAQSD between CMAQ and AQS) is 0.047 µg/m³ worse than the 3-level baseline — a null result. The diagnostic is ρ3 ≈ 0.995 across all five folds: at training sites, FAQSD and AQS are essentially identity (both encode the AQS network), so the extra rung adds GP variance without adding bias correction. The clearest lesson here: more fidelity rungs only help when each rung carries information not redundant with what follows it.
The model generalizes across years: key coupling varies only 0.016 over four independent years
Per-year fits across 2019–2022 show the top coupling coefficient varies only from 0.995 to 1.009. The linear structure generalizes across years without year-specific corrections. The 2020 wildfire-season anomaly (RMSE 5.09, failing the Tessum benchmark) is explained by the base model's blindness to smoke, not chain instability.
L5 FAQSD reference: RMSE 0.91 µg/m³ — but AQS-in-fitting
The EPA FAQSD Bayesian-fused product scores 0.91 µg/m³ against the same AQS panel — 3× better than L4 MFGP. This is the published-product reference ceiling, not an achievable target: FAQSD has access to neighbor AQS monitors in fitting. The ~3× gap from L4 (2.76) to L5 (0.91) quantifies the value of AQS-at-test-site information. L4 is the honest hero stat for an emissions-driven surrogate.
Daily estimates are outside scope — three independent tests agree
Three independent investigations each find that daily-cadence PM2.5 estimation degrades predictive accuracy relative to the annual chain and cannot be held to the same validation standard. Annual-mean estimation is the correct scope for all downstream health-impact calculations. This boundary was established empirically, not assumed.
Investigations
AQS Held-Out Validation Gate (L1)
RMSE 6.08 µg/m³; R² = −3.0; fails Tessum
L2 InMAP-Direct Validation Gate
RMSE 11.46 µg/m³; +5.39 vs L1; fails Tessum by 130%
L3 van Donkelaar V5.NA.05.02 Reference
RMSE 4.34 µg/m³; passes Tessum; MFB +0.108
L4 MFGP-Corrected (Le Gratiet multi-year)
RMSE 2.76 µg/m³ (2019); ρtop range 0.016 across 4 years
L5 FAQSD Reference (Bayesian-fused)
RMSE 0.91 µg/m³; AQS-in-fitting; not an operational rung
Cross-cascade Sobol (margin)
First-order + interaction Sobol indices on full cascade net benefit
Daily-cadence operational validation
Daily L4 cadence degrades accuracy; annual scope confirmed
Out-of-CA portability test (7 states)
MFGP chain portable across 7 contiguous U.S. states, 5 PM2.5 regimes
Daily L4 MFGP 2019
Daily L4 NOT licensed across 3 independent L1 sources
Cross-cascade Sobol (global sensitivity analysis)
Total-order Sobol: CRF (concentration-response function) and MFGP uncertainty dominate cascade net-benefit variance
Physics-informed GP kernel variant
Advection-diffusion kernel vs Matern-3/2: RMSE difference within fold noise
MAIAC AOD daily L1 attempt
MAIAC AOD daily L1 +132% RMSE vs FAQSD-direct — closes daily-cadence boundary alongside Investigation 3-9
How it connects to the rest of the cascade
The validated air quality model is the methodological spine of the study. Three downstream elements depend directly on its outputs:
- Element 4 (Co-benefits / disbenefits). Concentration Δμ for each policy scenario runs through the L4 MFGP posterior. The 95% credible interval on avoided deaths is computable and defensible precisely because the model uncertainty is quantified here.
- Element 6 (Ratepayer burden / net benefit). Investigation 6-3 (concentration-response function, CRF) and Investigation 6-4/44 (monetization) inherit the MFGP posterior via the cascade uncertainty chain. Investigation 3-10 Sobol identifies CRF and MFGP uncertainty as the two dominant contributors to total NB variance — Element 3 accuracy is the binding constraint on the Element 6 bottom line.
- Element 5 (Disadvantaged Communities equity analysis). DAC PM2.5 exposure differentials are calculated at census-tract resolution using the L4 MFGP surface. GP posterior uncertainty bounds propagate directly into the equity delta. The 2.76 µg/m³ station-level RMSE is a meaningful floor on tract-level uncertainty in high-concentration communities.